Indicators are issuing buy signal
US initial jobless claims data gave more attention to Gold. On the chart, gold price after a sharp descend reached a support level and was pumped smoothly. Right now the price is at the base of the ascending channel, which was formed several days ago, and ascending wave is expected.
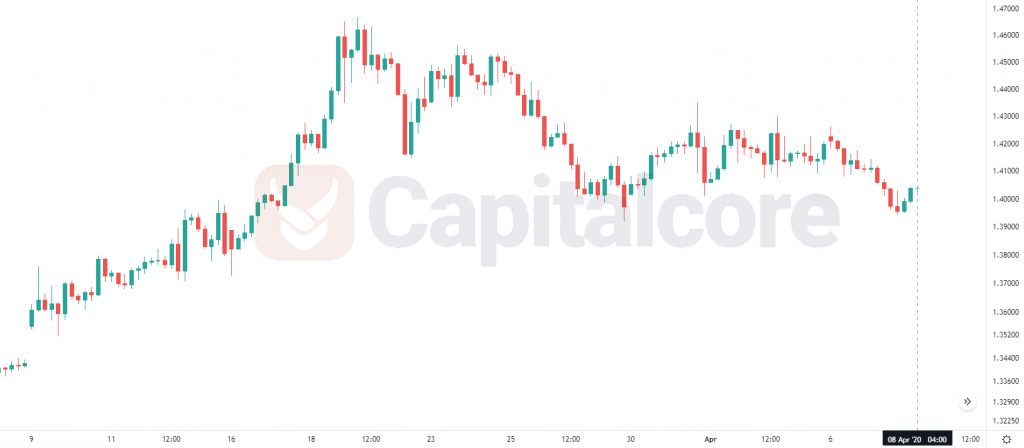
Chart Notes:
• Chart time-zone is UTC (+03:00)
• Candles’ time-frame is 4h.
The support rests at 1606.74 with resistance at 1636.14 which both lines are above the weekly pivot point at 1602.97. The EMA of 10 is moving with bullish bias in the ascendant channel and it is above the EMA of 200 and the EMA of 100. The RSI is moving on 50 level, the Stochastic is moving in high ranges and the MACD line is above the signal line in the positive territory. The ADX is showing buy signal. The price is above the Ichimoku Cloud and below the Chinkou Span. The Tenkan-sen is showing an upward trend while the Kijun-sen is showing a downward trend.
Long positions are recommended towards 1643.
• DISCLAIMER: Please note that the above analysis is not an investment suggestion by “Capitalcore Ltd”. This post has been published only for educational purposes.