Trend reversal signals have issued
As U.S. stock indexes are weakening Gold is getting more attention. On the chart, the price has descended within a channel and after a significant fall, currently started a bullish trend. The overall look of the chart is bullish and as it seem trend reversal has taken place.
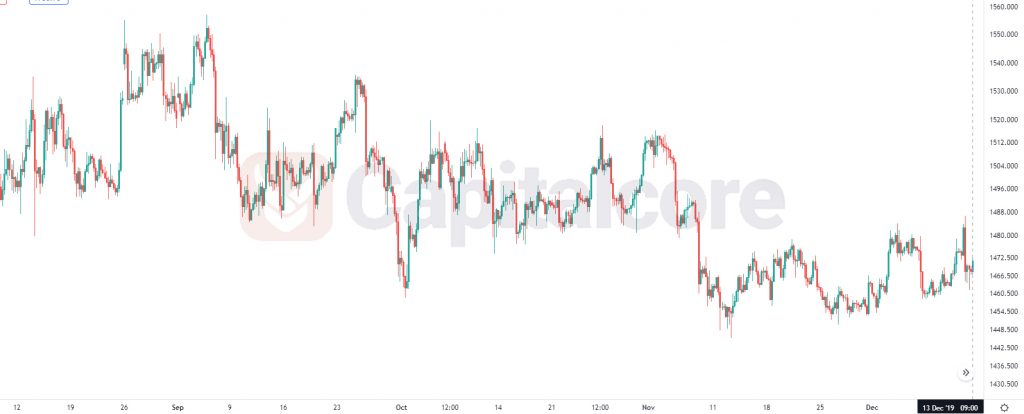
Chart Notes:
• Chart time-zone is UTC (+03:00)
• Candles’ time-frame is 4h.
The support rests at 1457.00 with resistance at 1464.40 which both lines are below the weekly pivot point at 1479.00. The EMA of 10 is moving with bullish bias in the descendant channel and it is below the EMA of 200 and the EMA of 100. The RSI is moving below 50 level, the Stochastic is moving in high ranges and the MACD line is above the signal line in the positive territory. The ADX is not showing any clear signals. The price is in the Ichimoku Cloud and above the Chinkou Span. The Tenkan-sen and the Kijun-sen are both showing a horizontal trend.
Long positions are recommended towards 1475.
• DISCLAIMER: Please note that the above analysis is not an investment suggestion by “Capitalcore Ltd”. This post has been published only for educational purposes.