- May 5, 2020
- Category: Market News
Dynamic support is pumping the price
Gold is getting empowered by the worldwide crisis. On the chart, the price is at the bottom of an ascending channel that formed a few weeks ago. Dynamic ascending trendline has pumped the price up few times before and now again the price is touching the line. The overall look of the chart is bullish.
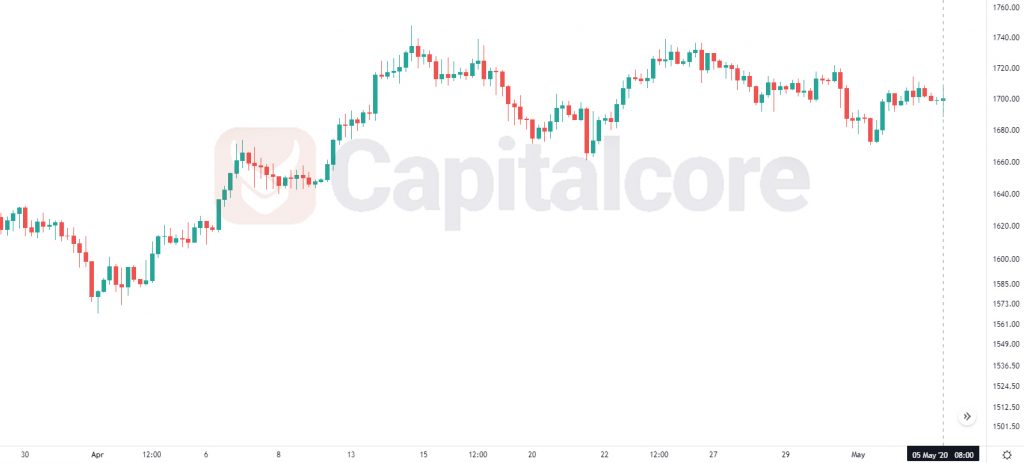
Chart Notes:
• Chart time-zone is UTC (+03:00)
• Candles’ time-frame is 4h.
The support rests at 1696.67 with resistance at 1710.94 which the weekly pivot point at 1707.57 is located in between the lines. The EMA of 10 is moving with bullish bias in the ascendant channel and it is above the EMA of 200 and the EMA of 100. The RSI is falling towards 50 level, the Stochastic is moving in low ranges and the MACD line is above the signal line in the positive territory. The ADX is not showing any clear signals. The price is in the Ichimoku Cloud and above the Chinkou Span. The Tenkan-sen is showing an upward trend while the Kijun-sen is showing a horizontal trend.
Long positions are recommended towards 1720.
• DISCLAIMER: Please note that the above analysis is not an investment suggestion by “Capitalcore Ltd”. This post has been published only for educational purposes.