Is this a correction phase or a trend reversal?
Gold faced strong resistance on 1958 and failed to grow further. The price fall down to the mid lane of the ascending channel, 1900. Indicators are not showing any special sell or buy signal. the overall look of the chart is bullish. The next move of the price is expected to be bullish but it is not suggested to enter a trade unless any signal triggers your trading setup.
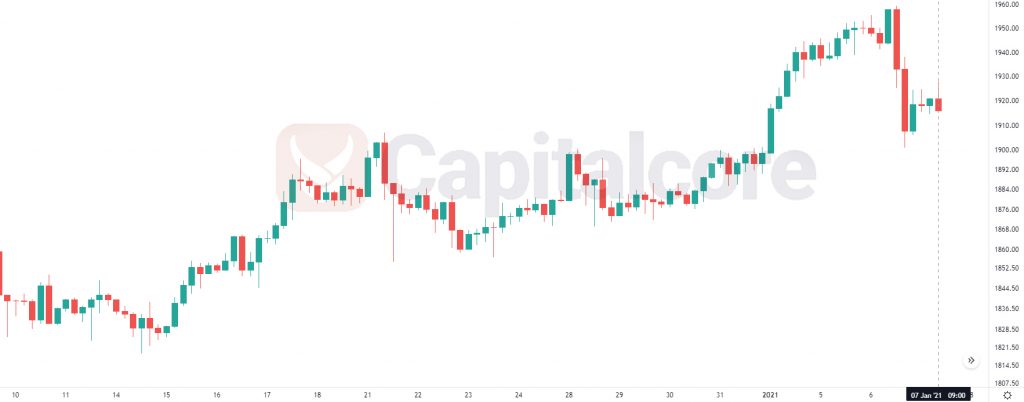
Chart Notes:
• Chart time-zone is UTC (+03:00)
• Candles’ time-frame is 4h.
The support rests at 1910.22 with resistance at 1930.12 which the weekly pivot point at 1891.00 is located below the lines. The EMA of 10 is moving with bearish bias in the ascendant channel and it is above EMA of 100 and 200. The Stochastic is moving in low ranges, the RSI is moving on level 50 and the MACD indicator is in negative territory. The ADX is not showing any clear signals. The price is in the Ichimoku Cloud and below the Chinkou Span. The Tenkan-sen is showing a horizontal trend and the Kijun-sen is showing an upward trend.
While considering pullbacks Gold is trying continue its growth towards 1965.
• DISCLAIMER: Please note that the above analysis is not an investment suggestion by “Capitalcore Ltd”. This post has been published only for educational purposes.