Bearish leg is forming
The poor economic performance has raised fears over demand for metals. Om the price chart, the price line broke below the strong support and had a sharp dump. There has not been any trend reversal signals issued and the descending wave is potential to continue for the next few days.
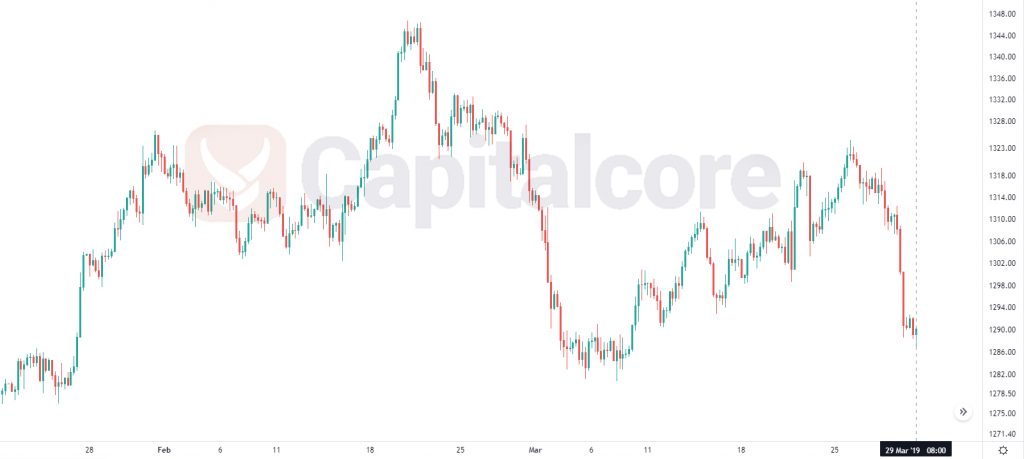
Chart Notes:
• Chart time-zone is UTC (+03:00)
• Candles’ time-frame is 4h.
The support rests at 1287.21 with resistance at 1296.31 which both lines are below the weekly pivot point at 1310.17. The EMA of 10 is moving with bearish bias in the descendant channel and it is below the EMA of 200 and the EMA of 100. The RSI is moving in oversold area, the Stochastic is moving in low ranges and the MACD line is below the signal line in the negative territory. The ADX is showing sell signal. The price is below the Ichimoku Cloud and the Chinkou Span. The Tenkan-sen is showing a downward trend while the Kijun-sen is showing a horizontal trend.
Short positions are recommended towards 1285 but then buyers can enter the market.
• DISCLAIMER: Please note that the above analysis is not an investment suggestion by “Capitalcore Ltd”. This post has been published only for educational purposes.