- January 23, 2025
- Posted By: james w
- Category: Market News
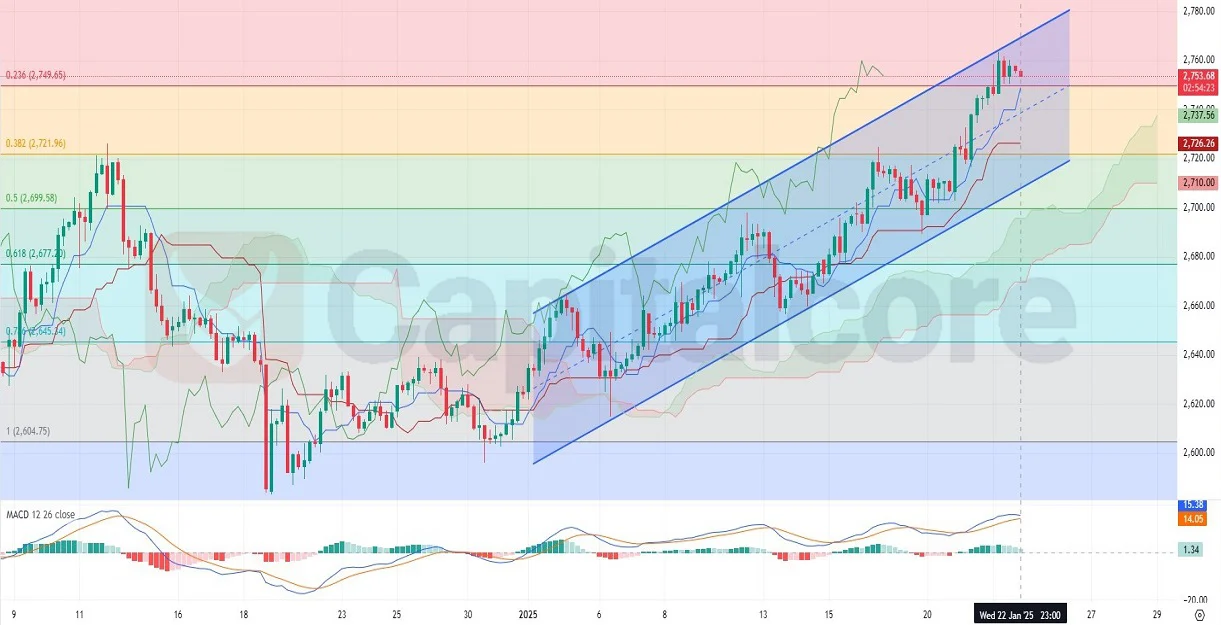
GOLDUSD Daily Chart Analysis with Ichimoku and Fibonacci
GOLD USD, also known as “XAU/USD,” is a popular currency pair that reflects the exchange rate between Gold and the US Dollar. Known for its role as a safe-haven asset, Gold is sensitive to both economic data and geopolitical events. Today’s USD news, including weekly jobless claims and crude oil inventory data, will be pivotal. Lower-than-expected unemployment claims could strengthen the USD, potentially pressuring Gold. Meanwhile, discussions at the World Economic Forum could drive significant volatility. With market sentiment hinging on these developments, traders are closely monitoring GOLD/USD price movements for potential opportunities.

Chart Notes:
• Chart time-zone is UTC (+02:00)
• Candles’ time-frame is 4h.
The GOLDUSD price on the H4 chart remains in a bullish trend, trading within a clearly defined ascending channel. The price is currently above the Ichimoku Cloud, a strong indication of sustained bullish momentum. Additionally, the Gold price has successfully broken above the 0.236 Fibonacci retracement level, signaling the potential for further upside toward the 0.382 Fibonacci level at $2,771.96. The MACD indicator supports this bullish outlook, with the MACD line above the signal line and a positive histogram showing strengthening momentum. The channel’s structure, with consistent higher highs and higher lows, emphasizes the strength of the current trend. Traders should watch for further price consolidation above the cloud and Fibonacci levels to confirm continued bullish movement.
• DISCLAIMER: Please note that the above analysis is not an investment suggestion by “Capitalcore LLC”. This post has been published only for educational purposes.