Trend reversal is about to occur
Gold price has ascended largely within a channel. The price has reacted to the mid, top and base line of the channel. The price is right now pretty close to the mid line of the channel. RSI is showing negative divergence and a descending wave looks to be close.
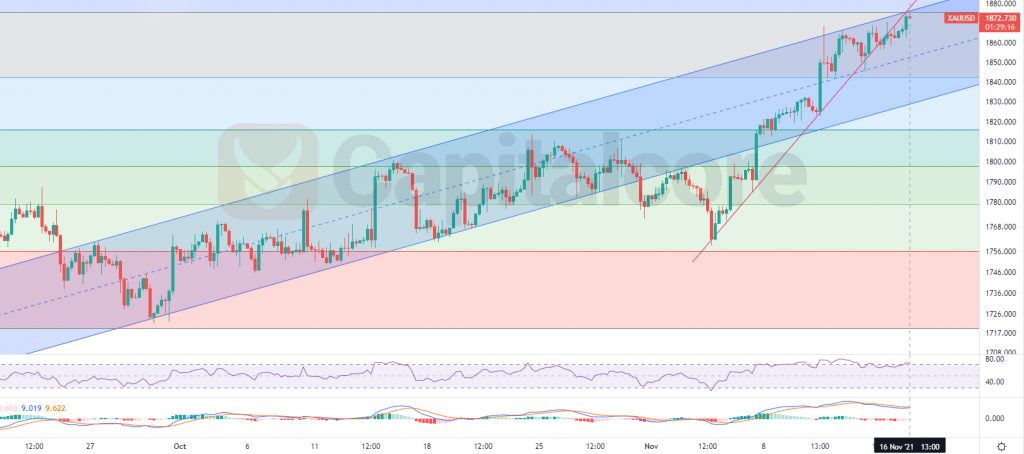
Chart Notes:
• Chart time-zone is UTC (+03:00)
• Candles’ time-frame is 4h.
As it is visible on the chart, the price line is at the top of the channel. Several attempts were made to break above the channel but the resistance is still valid and has not been broken. RSI is showing negative divergence and also is above 70. MACD is showing a weak bearish wave. An ascending trend line has broken and a retest was also made to the broken trendline. In case the resistance stays valid, bears can take the control of the market. Possible targets for the descending wave could be 1845 and 1817. Please consider that breaking above the channel will highly reduce the chance of descend.
• DISCLAIMER: Please note that the above analysis is not an investment suggestion by “Capitalcore Ltd”. This post has been published only for educational purposes.