A bullish wave can be expected
Gold price started descending trend on 12th of August 2022. The price line continued the bearish trend within a channel until October 3rd, when the price had a significant growth and was able to break above the channel. The price line is now compilating a pullback to the top line of the channel and a bullish wave is potential.
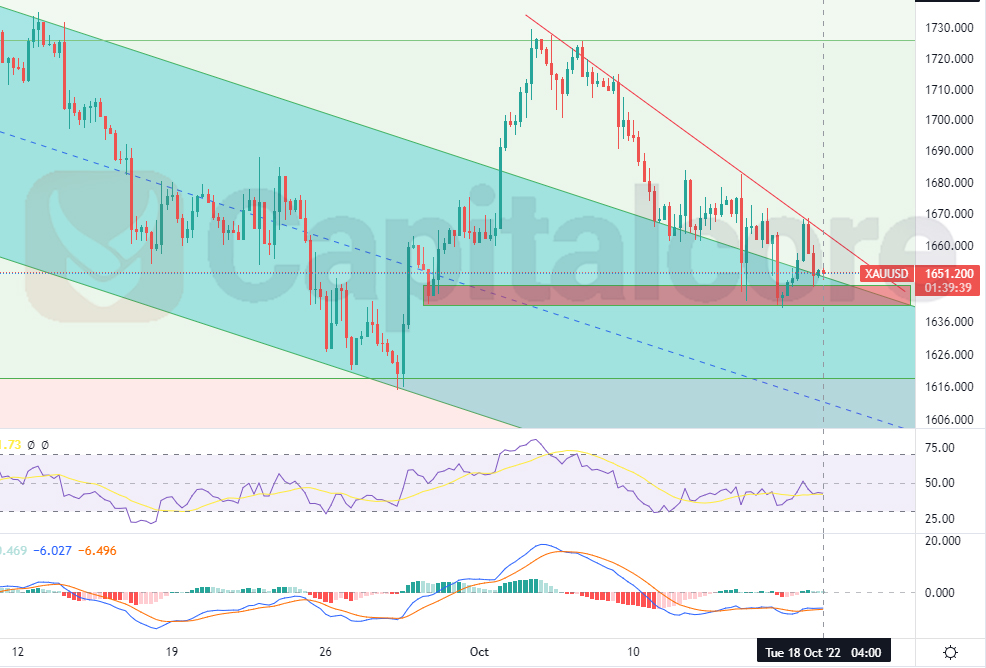
Chart Notes:
• Chart time-zone is UTC (+03:00)
• Candles’ time-frame is 4h.
The price line on Gold price chart is now indicating 1651.2; which occurs to be just above the broken channel. The channel is indicated with sky blue highlight. The red zone below the price line indicates a static support zone which was currently formed, and has already been able to pump the price line a couple of times. The red descending line above the channel reflects the trend line on the current, short term bearish leg. RSI is issuing positive divergence and MACD is showing potential for a bullish trend. Traders can expect the price line to break above the red line, there they can enter long positions heading to 1684, and 1715 after that. Also please consider that in case the price of gold falls below 1640, the validity of this analysis would highly be under question.
• DISCLAIMER: Please note that the above analysis is not an investment suggestion by “Capitalcore Ltd”. This post has been published only for educational purposes.