- March 21, 2022
- Category: Market News
Top line of the channel is being touched
Gold price started a bearish move on 8th of March 2022 and descended to 1895 on 16th of March 2022. The price line then started an ascending phase and ascended up to the top line of the channel. At the moment the price line is touching the top line and the next move would be a critical one.
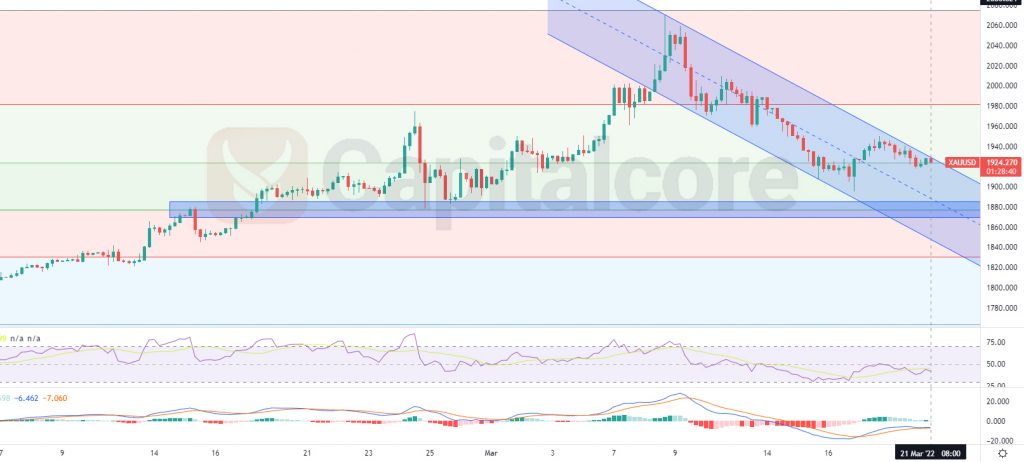
Chart Notes:
• Chart time-zone is UTC (+03:00)
• Candles’ time-frame is 4h.
The price line at the moment is on 1924.27 which would be just below the top line of the of the channel. Level 382 of the Fibonacci retracement lays just below the current position of the price line. The blue zone below the price line, indicates the resistance level which is of high importance, as it has been able to pump the price line several times in the past. and also it equals to level 0.5 of the Fibonacci retracement. In case the top line of the channel can resist once more, traders can be waiting for any descending trigger to enter short positions. The targets for the descending wave could be considered on 1885 and 1830. On the other hand, if the price line breaks above the descending wave, traders can be waiting for a retest of the top line of the channel; and there they can enter long positions and target 1986 and 2060.
• DISCLAIMER: Please note that the above analysis is not an investment suggestion by “Capitalcore Ltd”. This post has been published only for educational purposes.