The bullish trend has ended
The price line on Gold price chart, started a bullish trend, after breaking above the descending channel, on November the 8th. The price line is now approaching to a static support zone, breaking below this area could be followed by a big loss for Gold.
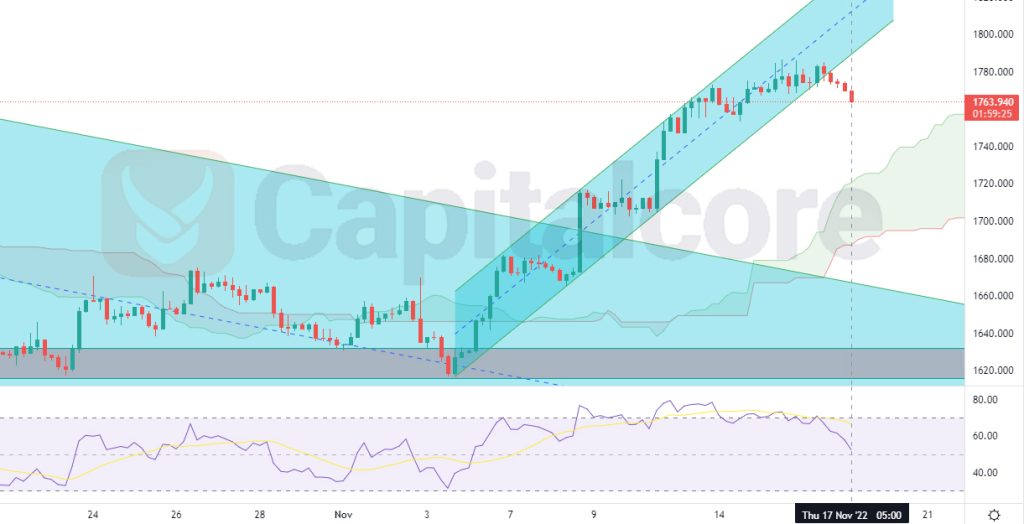
Chart Notes:
• Chart time-zone is UTC (+03:00)
• Candles’ time-frame is 4h.
The price line is currently indicating 1763.940, which would be just below the bullish microchannel, which was currently formed on the chart. Both the long term bearish channel and the bullish microchannel are highlighted with sky blue color. The price line is currently below this channel. There is a static support zone at about 1755, just below the price line. This area is of high importance for Gold, as breaking below this area would be followed by strengthening the bearish channel, and can cause this metal to lose value against USD. RSI is currently just above 50, showing indecision in the market and Ichimoku Cloud has a considerable distance to the price line. Sellers can enter the market after the price line breaks below the mentioned static resistance. The target for the bearish wave could be considered on 1705, and 1700. Also consider that, the reliability of this analysis would be highly taken under question, if the price line breaks above 1790
• DISCLAIMER: Please note that the above analysis is not an investment suggestion by “Capitalcore Ltd”. This post has been published only for educational purposes.