Bullish channel has formed
Gold is moving stronger against USD. On the chart the price is ascending within a channel and the channel is still valid, as the price has not broken above or below it yet. The overall look of the chart is bullish and an ascending leg is expected.
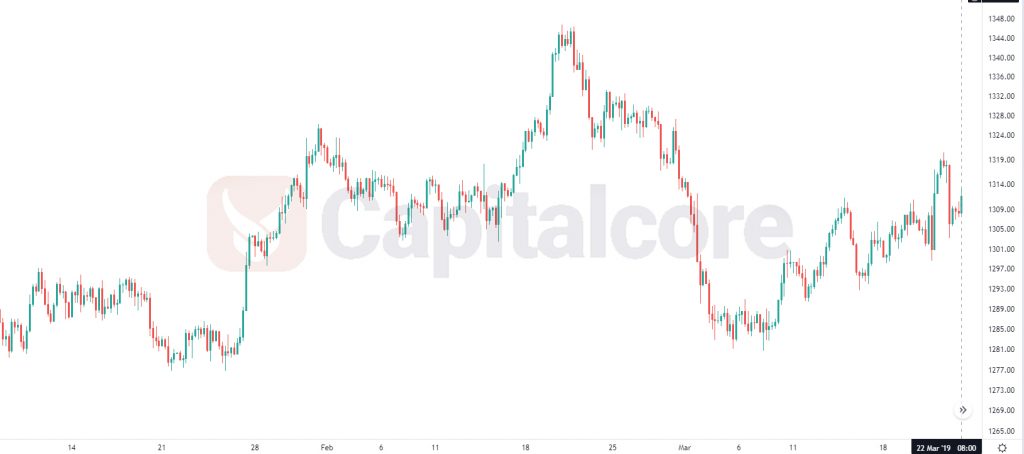
Chart Notes:
• Chart time-zone is UTC (+03:00)
• Candles’ time-frame is 4h.
The support rests at 1309.41 with resistance at 1314.48 which both lines are above the weekly pivot point at 1301.70. The EMA of 10 is moving with bullish bias in the ascendant channel and it is above the EMA of 200 and the EMA of 100. The RSI is rising towards overbought area, the Stochastic is showing upward momentum and the MACD line is below the signal line in the negative territory. The ADX is not showing any clear signal. The price is above the Ichimoku Cloud and the Chinkou Span. The Tenkan-sen is showing an upward trend while the Kijun-sen is showing a horizontal trend.
Long positions are recommended towards 1320.
• DISCLAIMER: Please note that the above analysis is not an investment suggestion by “Capitalcore Ltd”. This post has been published only for educational purposes.