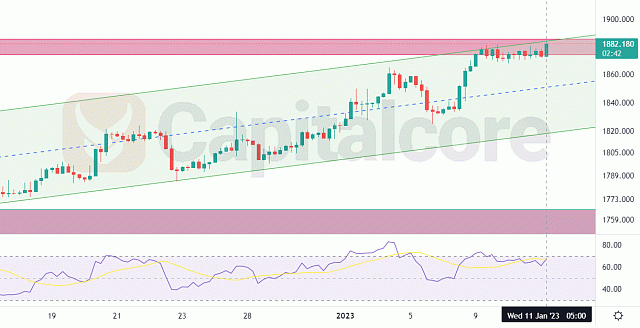
The resistance zoon does not look to be defeating
After weeks of bullish market, the price line on Gold price chart was finally able to touch the resistance zone at 1800. The bulls are now tiring and their power to overcome this resistance zone is now under question. Some bearish signals are being issued and a trend reversal seems to be close.

Chart Notes:
• Chart time-zone is UTC (+03:00)
• Candles’ time-frame is 4h.
The bullish wave in the gold price chart that saw the price line rise to resistance levels around 1880 appears to be coming to an end. A bullish channel has formed and the price line is currently at the upper line of this channel. The current price of gold also has static resistance, shown as a red box. The price line is currently responding to this area, indicating a potential bearish wave. The green zone below the price line is the support level that is considered the target of a bearish wave. RSI has issued a strong bearish divergence signal which could be considered as a signal for the bearish wave to initiate. Sellers can wait for a downside trigger to reignite the bearish market. The next wave target can be considered in the red support zone.
• DISCLAIMER: Please note that the above analysis is not an investment suggestion by “Capitalcore Ltd”. This post has been published only for educational purposes.