Gold price is still in the trading range
Gold price has been moving in a trading range since mid March 2022. The price line has been bouncing in a vertical channel, between level 0.5 and 0.236 of the Fibonacci retracement. Currently the price line is once more at the top of the channel and another descending wave is possible to occur.
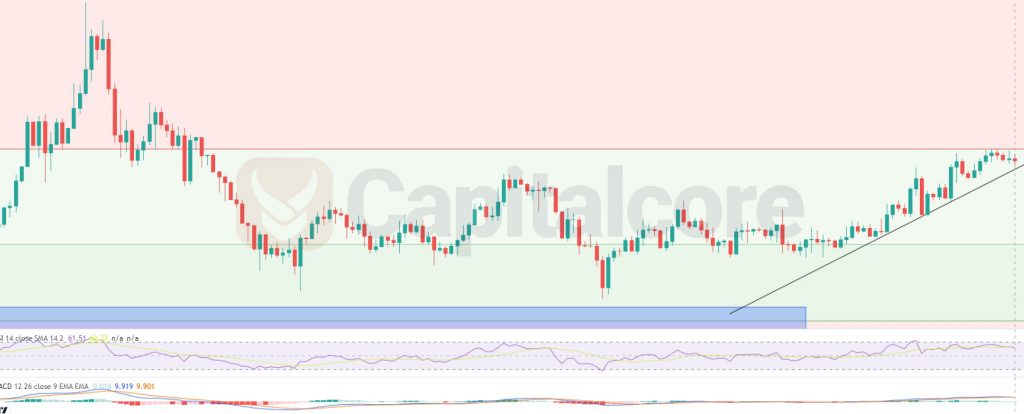
Chart Notes:
• Chart time-zone is UTC (+03:00)
• Candles’ time-frame is 4h.
On gold price chart, the price line is currently on 1970, which would be just below level 0.236 of the Fibonacci retracement on the previous major ascending wave. This level has been able to dump the price line multiple times before and is therefore expected to resist once more. The black line on the chart indicates the trend line which has formed the current ascending wave. The blue box indicates level 0.5 of The Fibonacci retracement where is expected to support the price in case of encountering. Traders can be waiting for the price line to break below the black trend line then they can enter short position on the retest of the broken trend line. The target of the descending wave could be considered on different Fibonacci levels.
Please note that the validity of this theory would highly reduced if the price line breaks above level 0.236 of the Fibonacci level.
• DISCLAIMER: Please note that the above analysis is not an investment suggestion by “Capitalcore Ltd”. This post has been published only for educational purposes.