The support level looks too fragile to hold the price
After a strong ascending wave, Gold price started a side way range and the price motion of the price line started to decrease. A support line is placed just below the price line, and a resistance level, just above the it. Traders should be waiting to see the few next candles to predict the next price movement.
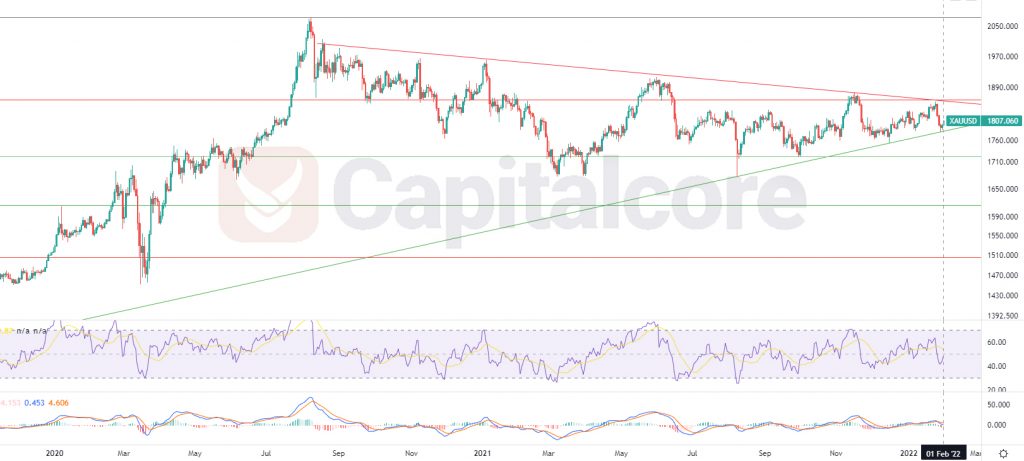
Chart Notes:
• Chart time-zone is UTC (+03:00)
• Candles’ time-frame is daily.
Gold price at the moment is on 1807, which would be below level 0.236 and above level 0.382 and has just reacted to the support line. The green line, below the price line indicates the dynamic resistance which started forming on 16th of August 2018, has not been been broken and therefore is considered a strong support. RSI is almost on 46 and MACD is showing weakness in the descending wave. Buyers can be waiting for the trendline to break above the Fibonacci level and then they can enter the market on the pullback; the targets for the ascending wave could be considered on 2000 and 2130. On the other hand, Bears can be waiting for the price line to break below the dynamic support to enter the market; the target for the descending wave could be 1680 and 1562.
• DISCLAIMER: Please note that the above analysis is not an investment suggestion by “Capitalcore Ltd”. This post has been published only for educational purposes.