- January 13, 2022
- Category: Market News
Next few candles are of high importance
After a significant fall, gold price started to cover some of the loss against dollar, within an ascending channel. Several reactions has been made to the top, mid and base line of the channel and the channel is still valid. Gold price at the moment is on a very important area and the next few candles can reveal the next wave.
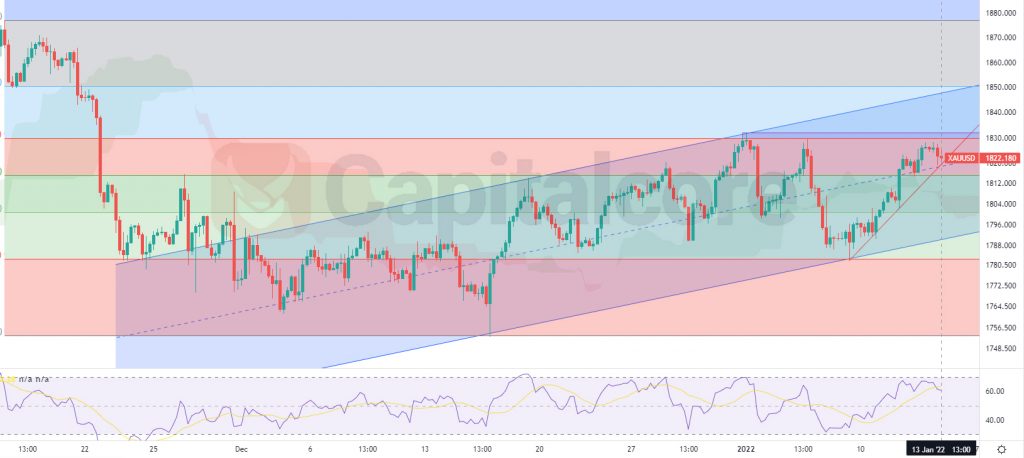
Chart Notes:
• Chart time-zone is UTC (+03:00)
• Candles’ time-frame is 4h.
The price at the moment, Gold price is 1822$. There is a dynamic support line below the price line; the support is shown as a red line of the chart. The other support level below the price line is the mid line of the channel. There is also a strong resistance level above the price line, the resistance level equals to level 0.618 of the Fibonacci retracement. RSI is almost on 60 and is showing a smooth divergence comparing to the price line. In case the price line breaks below the dynamic support level, sellers can be waiting for a retest of the line and then can enter the market. The possible targets for the descending wave would be 1800. On the other hand, if the price line breaks above level 0.618 of the Fibonacci retracement, buyers can enter the market and target 1850 and 1870 as the their take profit.
• DISCLAIMER: Please note that the above analysis is not an investment suggestion by “Capitalcore Ltd”. This post has been published only for educational purposes.