The price line is forming a descending wedge
Gold price started a strong descend on 19th of November. The descending power recently has reduces and the price line has started a horizontal trend. The price right now is stuck in a descending wedge paten and breaking to either sides would be a good entrance signal.
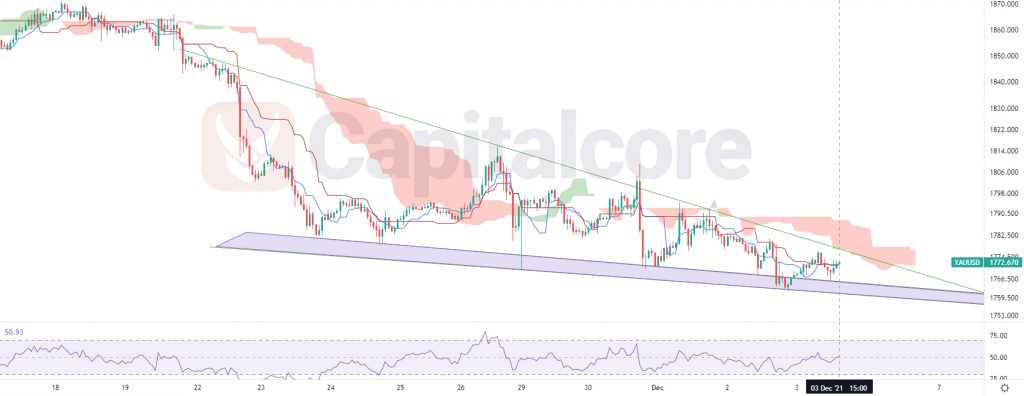
Chart Notes:
• Chart time-zone is UTC (+03:00)
• Candles’ time-frame is 1h.
On the chart, the price is on 1773 at the moment. RSI is showing almost 50. The price is below ichiimoku cloud and the cloud is red at the moment. the conversion line has just cut below the base line and is issuing sell signal. The resistance of the ichimoku flat is above the price line and and also is the dynamic trend line. The overall look of the chart is bearish and sellers can be waiting for the resistance area, colored in purple, to be broken and then they can enter a trade. The target for the descending wave could be set on 1720; and in case the price line breaks below that, the next possible target would be 1691.
• DISCLAIMER: Please note that the above analysis is not an investment suggestion by “Capitalcore Ltd”. This post has been published only for educational purposes.