The next descending wave looks close
gold price line that had broken below the ascending channel a couple of days ago, could recover the loss and is again in the channel. the price is currently on a strong resistance level. different indicators are issuing sell signals and the overall look of the chart is bearish.
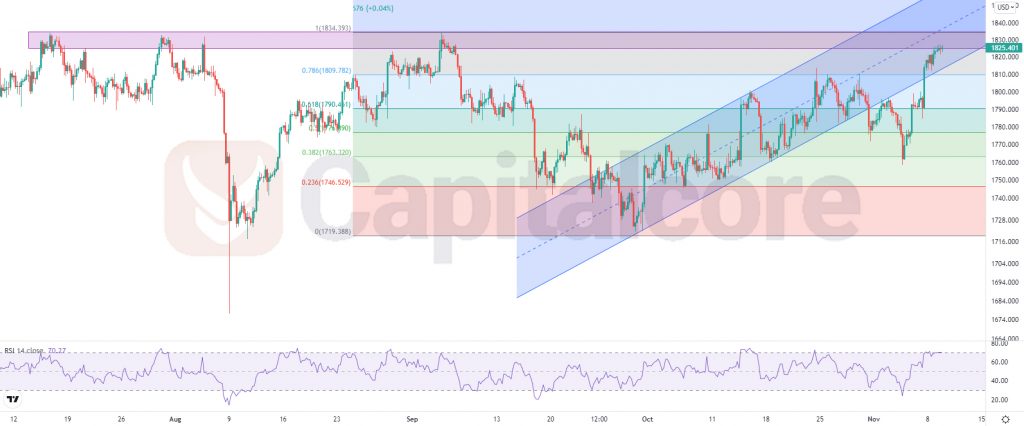
Chart Notes:
• Chart time-zone is UTC (+03:00)
• Candles’ time-frame is 4h.
The resistance level lays at 1825-1835. The area has pumped the price several times in the past and is indeed a strong resistance. RSI indicator is on 70 and is issuing sell signal. MACD suggests weakening of the ascending wave and everything is ready for an ascend. Sellers can target 1790 as their first TP; this area equals to 0.618 of the Fibonacci retracement and has acted as a support level several times. The next TP for the ascending wave could be level 0.382 of the Fibonacci retracement, which would be 1765. please note that breaking above the resistance at any point will ruin the possibility of ascend.
• DISCLAIMER: Please note that the above analysis is not an investment suggestion by “Capitalcore Ltd”. This post has been published only for educational purposes.