The bearish channel is broken
Gold price started moving within a bearish channel on 18th of April 2022. The price line descended up to almost 10.6 % in 28 days, until 16th of May 2022, when the price line hit the bottom line of the channel for the last time and then started an ascending wave. Right now, the price line is above the top line of the channel and the ascending wave is potential to be going on for the next few days.
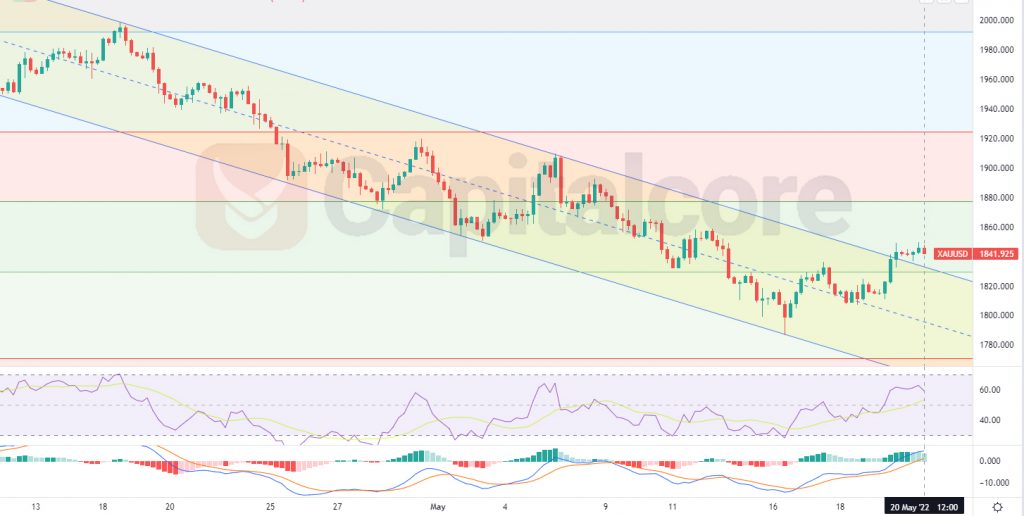
Chart Notes:
• Chart time-zone is UTC (+03:00)
• Candles’ time-frame is 4h.
The price line On Gold price chart is currently lying on almost 1842, which would be just above a strong resistance level. The yellow zone on the chart, indicates the bearish channel, and as it is visible on the chart, the price line has broken above this channel. The bright green line below the price line indicates level 0.382 of the Fibonacci retracement on the previous major descending wave on weekly time frame; this area also equals to the top line of the descending channel. This area has pumped the price line several times in the past and therefore is considered as an important zone. RSI and MACD are showing bullish wave still going on and the overall look of the chart is bullish. Traders can be waiting for the price line to have a retest of the broken channel and then they can enter long positions; the target for the ascending wave could be considered on 1880 and 1925.
Please consider that this theory is of value just as long as the price line has not broken inside the channel.
• DISCLAIMER: Please note that the above analysis is not an investment suggestion by “Capitalcore Ltd”. This post has been published only for educational purposes.