The resistance level is still valid
Gold price, after going through a strong ascending wave on 21st of July 2022 to 10th of August 2022, reacted to its dynamic resistance level, but could not break above this level. The bullish wave looks to be done and the overall look of the price chart is now turning bearish, while several indicators have issued negative divergence signals.
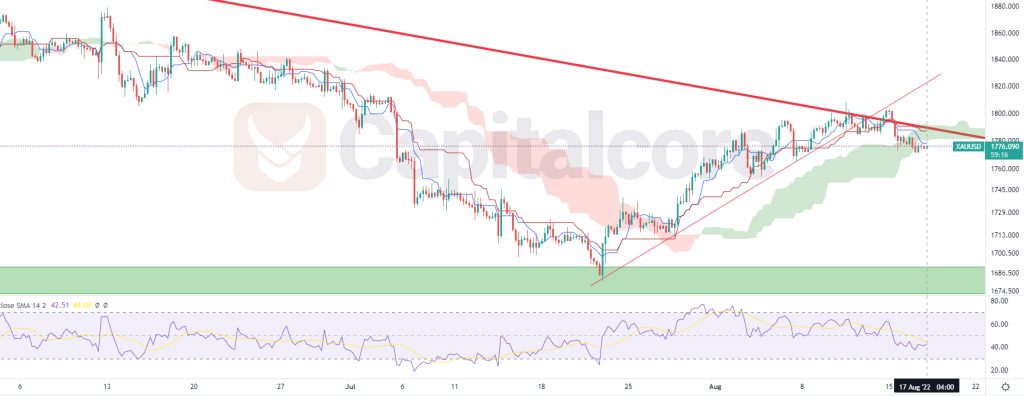
Chart Notes:
• Chart time-zone is UTC (+03:00)
• Candles’ time-frame is 4h.
The price line on Gold price chart is currently indicating 1776.090; which is located just below the strong dynamic resistance, shown as a red descending line. The ascending slope of the price line is decreasing and the market is showing potential for going through another bearish wave. There is also a static resistance level, which has currently been formed on 1798.766 – 1808.375. The ascending thin red line on the chart indicates the ascending trend line that formed the previous ascending leg; as it is reflected on the price chart, the price line has broken below the mentioned trend line and therefore the bullish wave is technically expired. RSI has started a bearish trend and is still going through it, and the price line has broken below the Ichimoku cloud, while the currently formed cloud has turned red. Bears can be waiting for the price line to have another retest of the static resistance level that was mentioned above, there they could enter short positions and expect to see the price line at about 1720 and 1677.
The validity of the above analysis remains untouched, as long as the price line would not break above 1810.
• DISCLAIMER: Please note that the above analysis is not an investment suggestion by “Capitalcore Ltd”. This post has been published only for educational purposes.