- March 1, 2022
- Category: Market News
Ascending trend is still on going
Ukraine conflict has effected the market majorly; Metals, stocks and the currency of the countries which are engaged in war, are effected more than other pairs and assets. On gold price chart, the price line has broken above the resistance and is forming a bullish trend line, another bullish wave might be close.
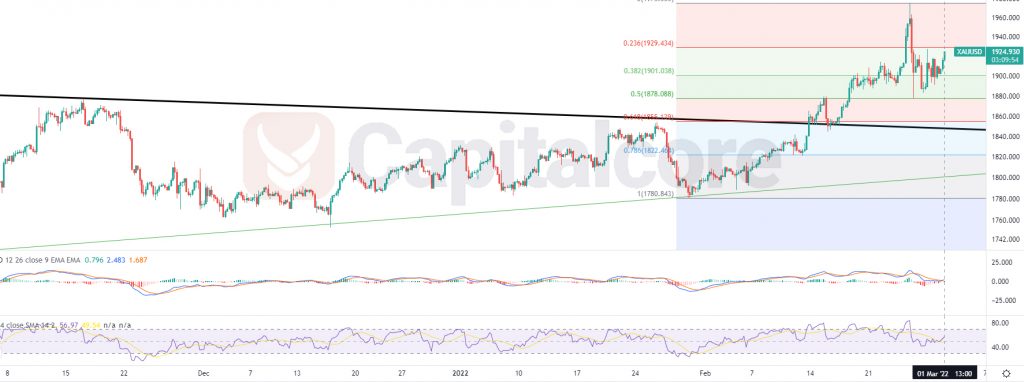
Chart Notes:
• Chart time-zone is UTC (+03:00)
• Candles’ time-frame is 4h.
Gold price is on 1924.93 at the moment. The black line on the chart shows a long term descending trendline which started forming at the beginning of August 2020; the price line broke above this trend line on 14th of February 2022. The price then had a retest of the broken resistance and could ascend up to 1974.485 and then entered a correction phase. An up trend has formed and it looks to be still valid. RSI is almost on 58 and MACD indicates the commencement of a new bullish wave. Traders can be waiting for the price line to enter another correction phase and then they can enter long positions. The target for the ascending wave could be considered around 1960 and 2012. Please consider that the price should nor break below the resistance which has been shown as a black line, to maintain the possibility of a big ascend.
• DISCLAIMER: Please note that the above analysis is not an investment suggestion by “Capitalcore Ltd”. This post has been published only for educational purposes.