An ascending trend has been formed
USD empowerment is weighing on Gold. Gold price has declined significantly during the past month. Finally the price could break out of the ascending wave several days ago and now is forming a bullish channel. Different indicators are showing trend reversal signals.
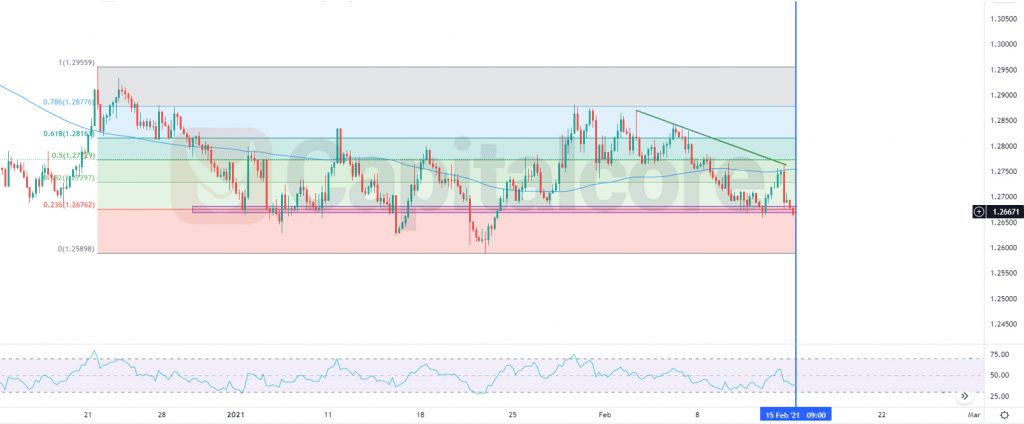
Chart Notes:
• Chart time-zone is UTC (+03:00)
• Candles’ time-frame is 4h.
The support rests at 1464.79 with resistance at 1472.79 which both lines are above the weekly pivot point at 1463.40. The EMA of 10 is moving horizontally in the ascendant channel and it is below the EMA of 200 and the EMA of 100. The RSI is moving on 50 level, the Stochastic is showing upward momentum and the MACD line is below the signal line in the negative territory. The ADX is showing buy signal. The price is above the Ichimoku Cloud and the Chinkou Span. The Tenkan-sen and the Kijun-sen are both showing a horizontal trend.
Long positions are recommended towards 1475.
• DISCLAIMER: Please note that the above analysis is not an investment suggestion by “Capitalcore Ltd”. This post has been published only for educational purposes.