Bullish Gold Trend: Technical Chart Insights
The H4 chart for gold shows a recent bullish trend, indicated by the last 21 dots of the Parabolic SAR (Stop and Reverse) being positioned below the candles. This suggests a potential continuation of the uptrend as long as the price remains above these dots. The Bollinger Bands are widening, indicating increased market volatility and potential for larger price movements. The recent candlesticks are trading above the middle Bollinger Band, the 20-period moving average, which acts as a dynamic support level in an uptrend.
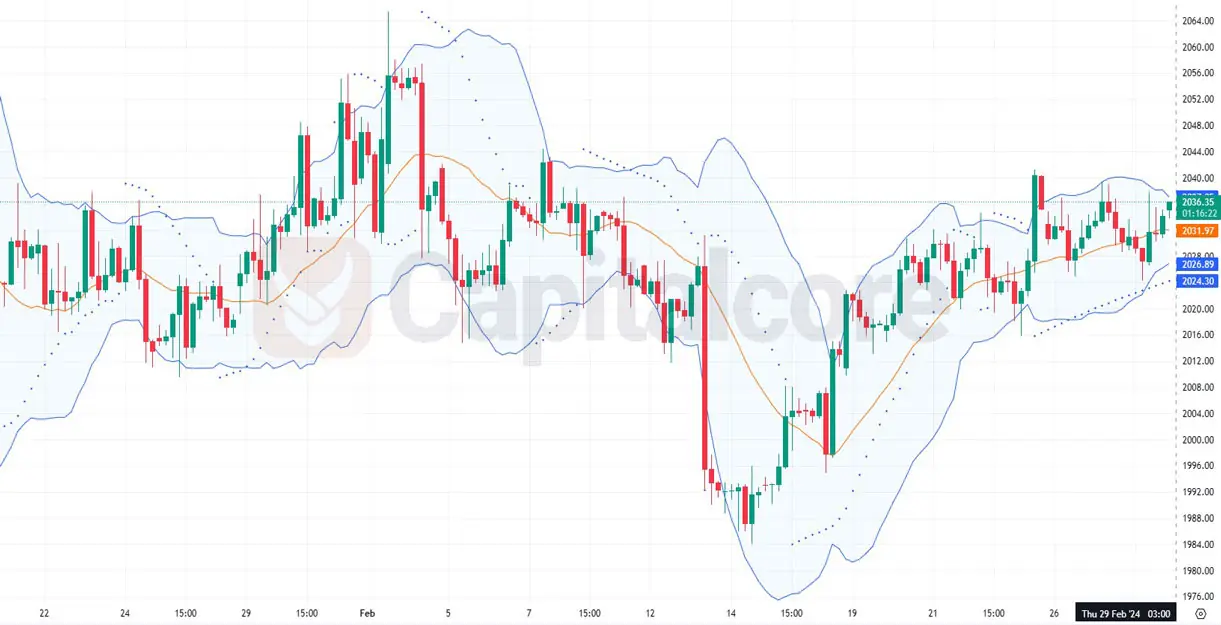
Chart Notes:
• Chart time-zone is UTC (+03:00)
• Candles’ time-frame is 4h.
Further technical analysis reveals that the moving average convergence divergence (MACD) is above the signal line, which typically signals bullish momentum. Additionally, the price has consistently found support at the lower Bollinger Band before rebounding, showing resilience in the uptrend. However, traders should be cautious of any bearish reversal patterns or a crossover of the Parabolic SAR above the price, which could indicate a potential trend reversal. It’s also noteworthy that the last few candlesticks show smaller bodies with longer wicks, suggesting indecision among traders. As the market approaches the upper Bollinger Band, resistance may be encountered, and a pullback towards the middle band or beyond could be possible if bearish pressure mounts. Monitoring upcoming candles for a continuation or reversal pattern, such as a bullish or bearish engulfing, will be crucial for confirming the trend’s strength.
• DISCLAIMER: Please note that the above analysis is not an investment suggestion by “Capitalcore Ltd”. This post has been published only for educational purposes.