Bull Market Gold: Reading the Technicals
Gold, a precious metal treasured by civilizations for millennia, remains a cornerstone of financial security, often sought after for its stability and potential to hedge against inflation. As an investment asset, it continues to draw attention for its unique position within the global economic landscape.
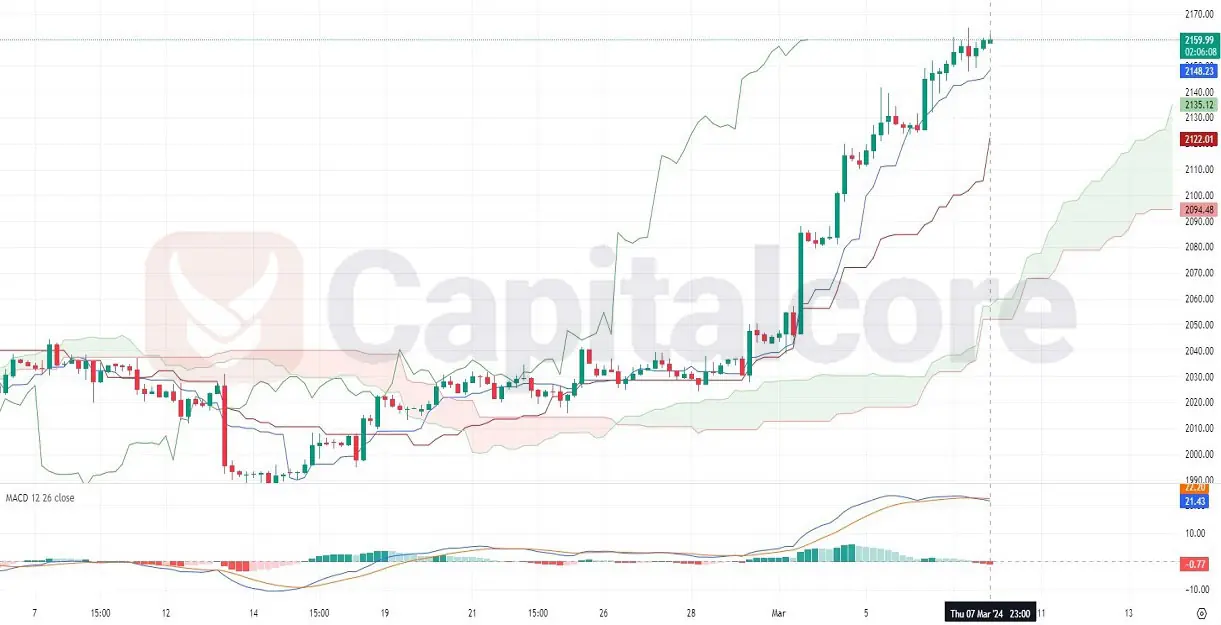
Chart Notes:
• Chart time-zone is UTC (+03:00)
• Candles’ time-frame is 4h.
The provided chart reveals a bullish trend for gold, as evidenced by the consistent series of higher highs and higher lows. The Ichimoku Cloud indicates a strong uptrend, with the price trading well above the cloud, while the cloud itself is expanding, which could imply a strengthening momentum. The Moving Average Convergence Divergence (MACD) reinforces this perspective, displaying a significant distance between the MACD line and the signal line. This suggests that the upward movement has robust backing. The histogram also supports the bullish scenario, with increasing green bars confirming the positive sentiment in the market. However, it is essential for traders to monitor for any potential bearish crossovers in the MACD or price movements below the cloud, which could signal a trend reversal.
• DISCLAIMER: Please note that the above analysis is not an investment suggestion by “Capitalcore Ltd”. This post has been published only for educational purposes.