The resistance level is still valid
As we are approaching to the release time of the Inflation rate in Canada, today we are analyzing the price line on USDJPY to indicate the potential trading opportunity on this pair. The price line has been analyzed according to the price action, MACD and Volume indicators.

Chart Notes:
• Chart time-zone is UTC (+03:00)
• Candles’ time-frame is 4h.
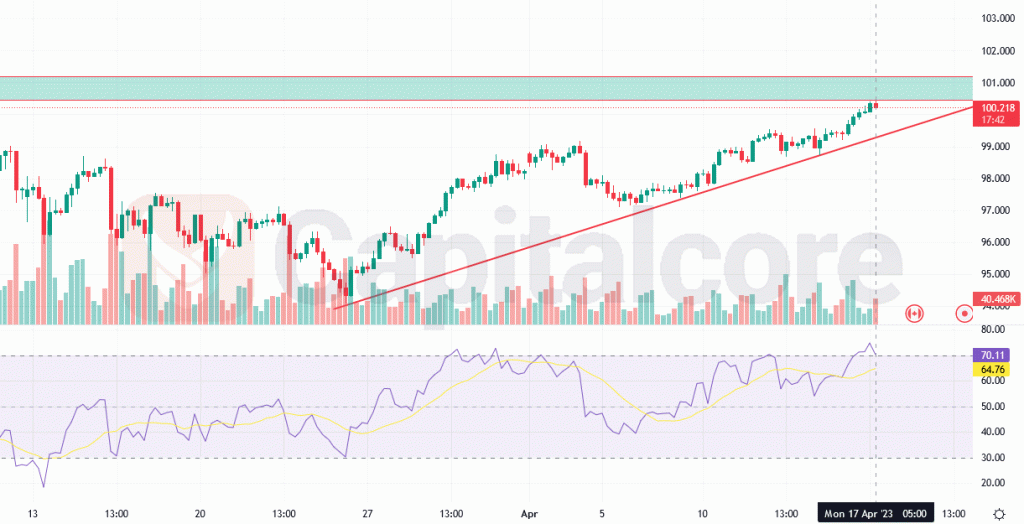
As you can see on the price chart, the price line on USDJPY started an ascending wave on March 24th 2023, moving towards the resistance level at around 100, which is reflected as a blue-green box above the price line. The price line is about to form the first bearish candle after touching this zone, which could be considered as a bearish signal, along with RSI indicating the over-buying zone and the downfall of trading volume, which indicates traders, not supporting the current trend on the market. Traders could expect a bearish wave after the price line breaks below the current bullish trend line, after which they can set sell positions on the resistance level. Remember that a logical risk management is an essential factor for successful any asset. trade
• DISCLAIMER: Please note that the above analysis is not an investment suggestion by “Capitalcore Ltd”. This post has been published only for educational purposes.