Traders anticipating bullish breakout
The USD/ZAR is a currency pair that represents the exchange rate between the US dollar and the South African rand. In recent times, the USD/ZAR has exhibited a range-bound trading pattern, moving in a horizontal direction with no clear trend in either direction.
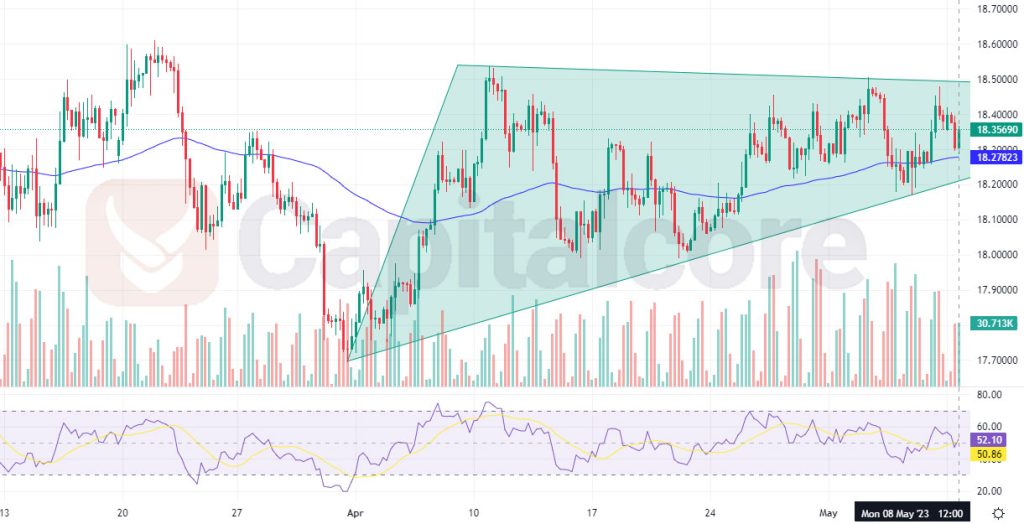
Chart Notes:
• Chart time-zone is UTC (+03:00)
• Candles’ time-frame is 4h.
Based on the analysis you have provided, the price line of USD/ZAR has formed an ascending triangle pattern on the chart. This pattern is formed by a horizontal resistance line and an ascending trendline, which converge to form a triangle shape. Traders often interpret this pattern as a bullish signal, suggesting that the buyers are gaining strength and may push the price higher. Traders may also be expecting a bullish breakout from the ascending triangle pattern, which would signal a potential long entry opportunity. A bullish breakout occurs when the price breaks above the horizontal resistance line, indicating that the buyers have gained control and may push the price higher. However, it is important to note that technical analysis is not always accurate and should be used in conjunction with other forms of analysis. It is also important to consider other factors that may influence the USD/ZAR, such as economic indicators, political events, and market sentiment.
• DISCLAIMER: Please note that the above analysis is not an investment suggestion by “Capitalcore Ltd”. This post has been published only for educational purposes.