Resistance and Trend Reversal
As of April 19, 2023, the EUR/USD price has reached a resistance level after experiencing a bullish wave. This suggests that the buyers are encountering some selling pressure at this level, making it harder for the price to continue to rise.
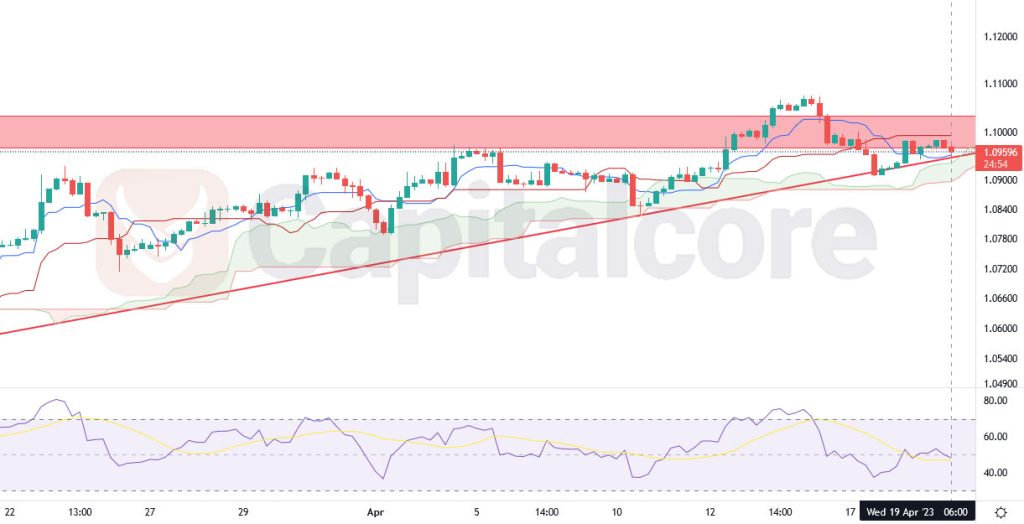
Chart Notes:
• Chart time-zone is UTC (+03:00)
• Candles’ time-frame is 4h.
Additionally, the Ichimoku cloud, a popular technical analysis tool, is currently below the price line. This indicates that the overall trend is still bearish and there may be a lack of support for the current price level. However, it is worth noting that the cloud is relatively thin, which suggests that there may be less resistance in the near term. The red line below the price line, known as the Tenkan-Sen line, is also indicating a bullish trend. However, the fact that it is below the price line and is likely to cross over the blue line (Kijun-Sen) in the near term, suggests that there may be a potential trend reversal on the horizon.
Overall, while the current bullish trend is still intact, the combination of the resistance level, the position of the Ichimoku cloud, and the potential crossover of the Tenkan-Sen and Kijun-Sen lines suggests that a trend reversal may be in the works. As always, it is important to monitor these technical indicators and keep an eye on any fundamental developments that may impact the EUR/USD exchange rate.
• DISCLAIMER: Please note that the above analysis is not an investment suggestion by “Capitalcore Ltd”. This post has been published only for educational purposes.