Gauging Market Sentiment for Gold Prices
The XAU/USD pair represents the price of gold in terms of the U.S. Dollar. Gold, often referred to as a safe-haven asset, plays a crucial role in global markets, particularly in times of economic uncertainty. The pair is actively traded by investors looking to hedge against inflation, economic instability, or as part of broader portfolio diversification strategies.
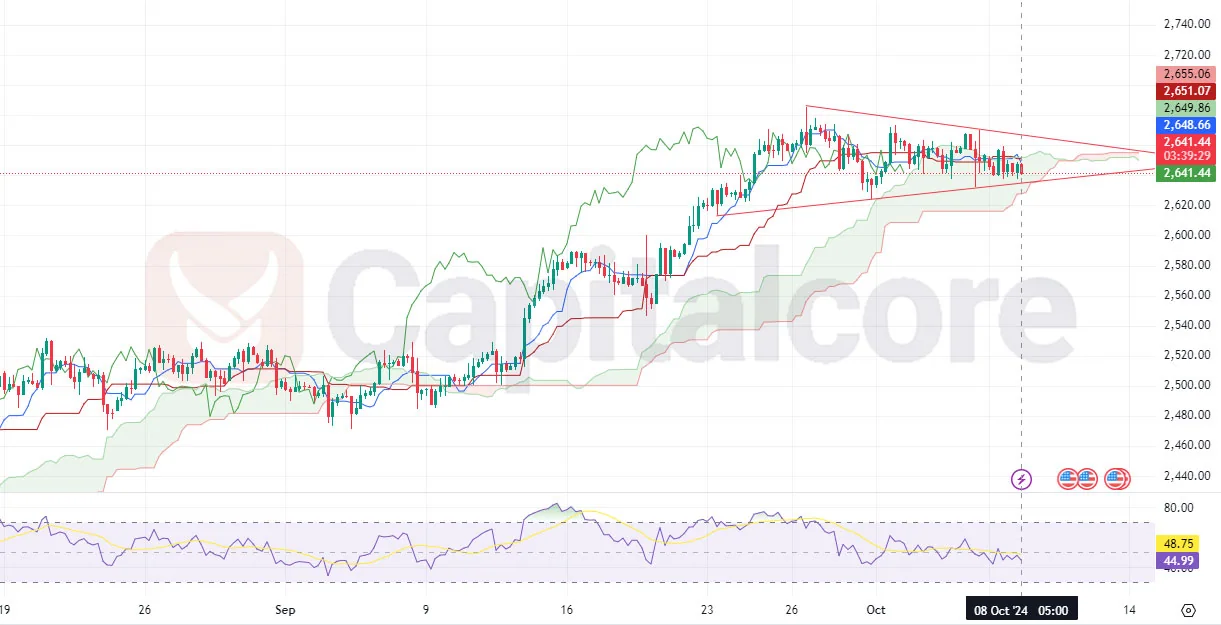
Chart Notes:
• Chart time-zone is UTC (+03:00)
• Candles’ time-frame is 4h.
The 4-hour chart of XAUUSD shows the price consolidating within a symmetrical triangle pattern, indicating a period of indecision in the market. This triangle is formed as the price makes lower highs and higher lows, compressing into a smaller range. Both the Ichimoku Cloud and the RSI indicators are signaling mixed momentum, with the price hovering near key support levels. The RSI at 44.99 suggests neutral momentum, with room for further movement in either direction, while the cloud reflects mild bullish support but not strong enough to confirm a clear uptrend.
If the price breaks above the upper trendline of the triangle, it could signal a bullish continuation, potentially targeting the $2,650 level. Conversely, a break below the lower boundary could push the price toward the support near $2,600 or even lower. Traders are likely waiting for a breakout from this consolidation phase, as the current setup suggests an impending move, but the direction remains uncertain until confirmation.
DISCLAIMER: Please note that the above analysis is not an investment suggestion by “Capitalcore LLC”. This post has been published only for educational purposes.