- Category: Market News
Bearish signals in USD/CAD pair
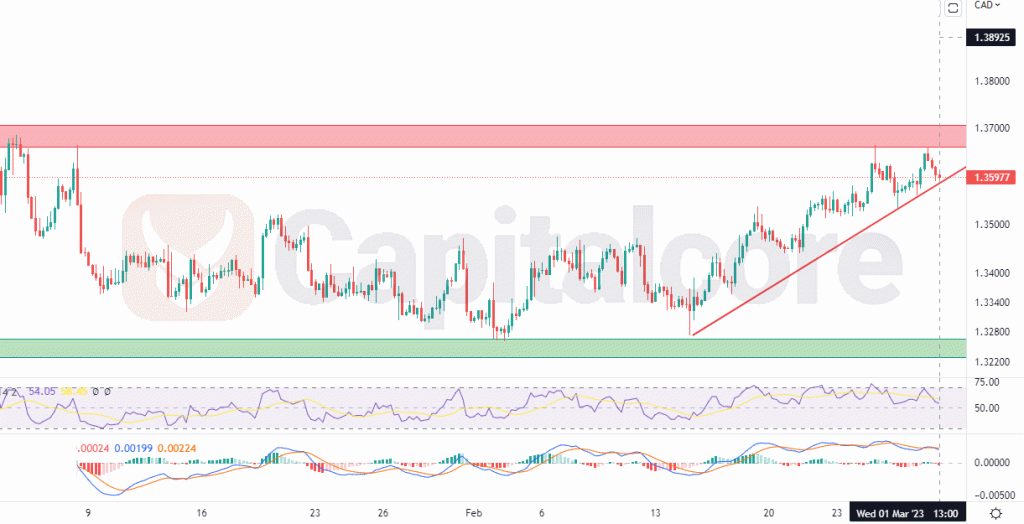
By analyzing price charts and using indicators such as the Relative Strength Index (RSI), traders can identify potential entry and exit points, as well as the overall trend of the market. In this case, the USD/CAD currency pair is showing bearish signals, indicating that a downward price movement may be imminent.

Chart Notes:
• Chart time-zone is UTC (+03:00)
• Candles’ time-frame is 4h.
The USD/CAD currency pair has recently gone through a bullish wave, however, its current price action shows that it is currently at a resistance level. The price line has formed a double top, indicating that the bulls are struggling to push the price further up. Moreover, the Relative Strength Index (RSI) is showing negative divergence, which is another bearish signal. Therefore, traders looking to sell the pair can look for an entry point once the price line breaks below the red trend line. If this happens, the sellers can target the support levels of 1.33790 and 1.33000 as their take profit points.
• DISCLAIMER: Please note that the above analysis is not an investment suggestion by “Capitalcore Ltd”. This post has been published only for educational purposes.