The price line might experience a trend reversal
The price line on NZD/CAD price chart, has been moving within a descending channel since 22nd of February 2021. Several reactions has been made to the top, bottom and midline of the channel. On 23rd of March 2022, the price line started descending after touching the top line of the channel for the last time, and now it is approaching to a strong support zone.
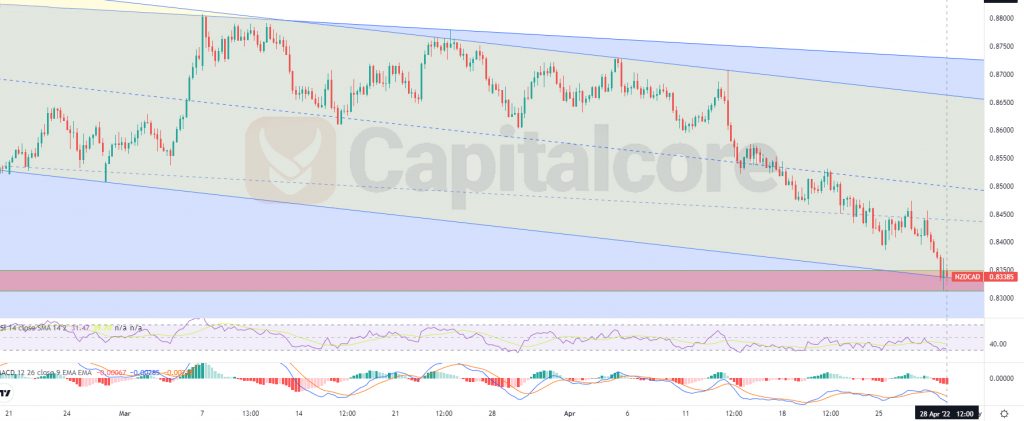
Chart Notes:
• Chart time-zone is UTC (+03:00)
• Candles’ time-frame is 4h.
The price line is at the moment on 0.83385, which would be just on a strong support line. The Green zone on the chart, indicates the descending channel on weakly timeframe. The bright yellow zone, shows the descending micro channel which has formed currently after the price line touched the top line of the channel. The red is the static support which is expected to pump the price line. As you see the price line is reacting to the static support as well as the base line of the micro channel. RSI is issuing positive divergence and MACD is showing descending wave on going. Traders can be waiting for the price line to form an ascending pattern or any other bullish trigger to enter long positions. The target for bulls can be considered on the mid and top line of the yellow channel.
Please consider that, breaking below the red zone, would most probably be followed by a descending wave, heading for the base line of the yellow channel.
• DISCLAIMER: Please note that the above analysis is not an investment suggestion by “Capitalcore Ltd”. This post has been published only for educational purposes.