A Bearish Trend Meets Bullish Hints
In the provided chart for the NZD/CAD currency pair, the overall trend appears to be bearish, as indicated by the price action staying consistently below the moving average and the Bollinger Bands moving downwards. However, there’s a recent uptick as the price has pushed above the moving average, signaling a potential shift in momentum or a retracement. The Bollinger Bands are beginning to widen slightly, suggesting an increase in market volatility and possibly a stronger move in either direction.
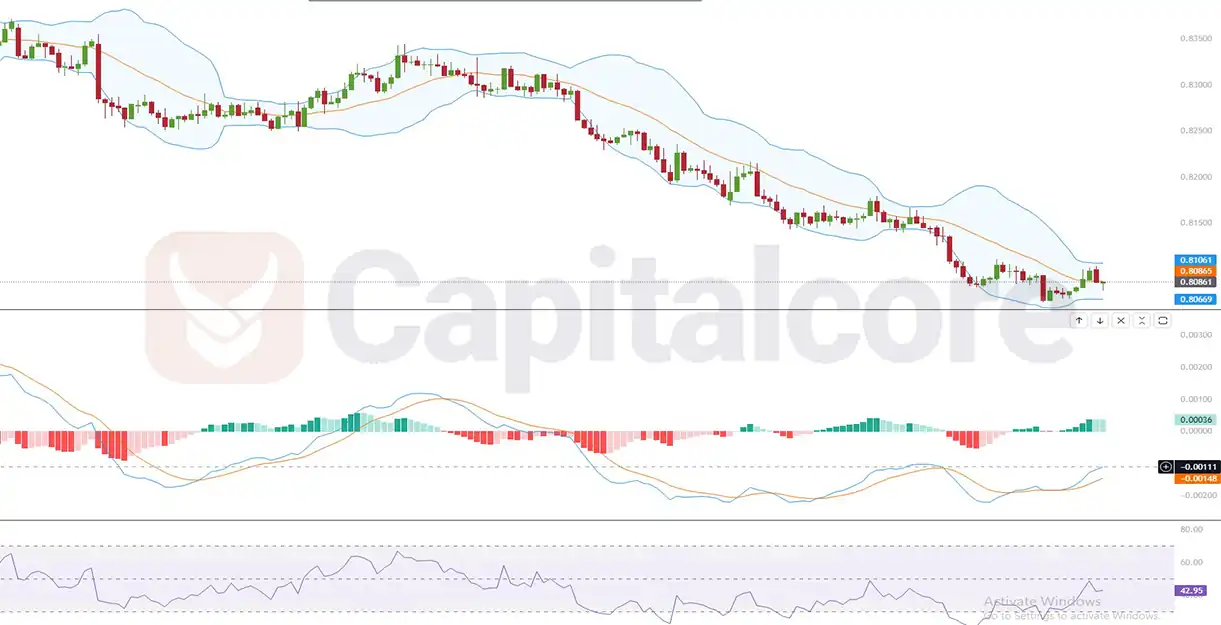
Chart Notes:
• Chart time-zone is UTC (+03:00)
• Candles’ time-frame is 4h.
The RSI indicator shows a recent increase in value, moving away from the oversold territory towards the mid-line. This indicates a growing bullish momentum, albeit within the context of a longer-term downtrend. The MACD histogram is reflecting a decrease in bearish momentum with the histogram bars moving higher, and the MACD line is closing in on the signal line from below. If the MACD line crosses above the signal line, this would be a further bullish signal. These indicators together may suggest a pullback or a trend reversal if the upward price action continues, warranting close monitoring for confirmation of a sustained shift.
• DISCLAIMER: Please note that the above analysis is not an investment suggestion by “Capitalcore Ltd”. This post has been published only for educational purposes.