The bearish channel is broken
On NZD/CHF price chart, the price started a bearish trend on 23rd of March 2022, during this bearish trend; the price line experienced a 5.22% value loss. Finally at 2nd of the June 2022, the price line entered an ascending phase, during which the price line broke above the descending channel.
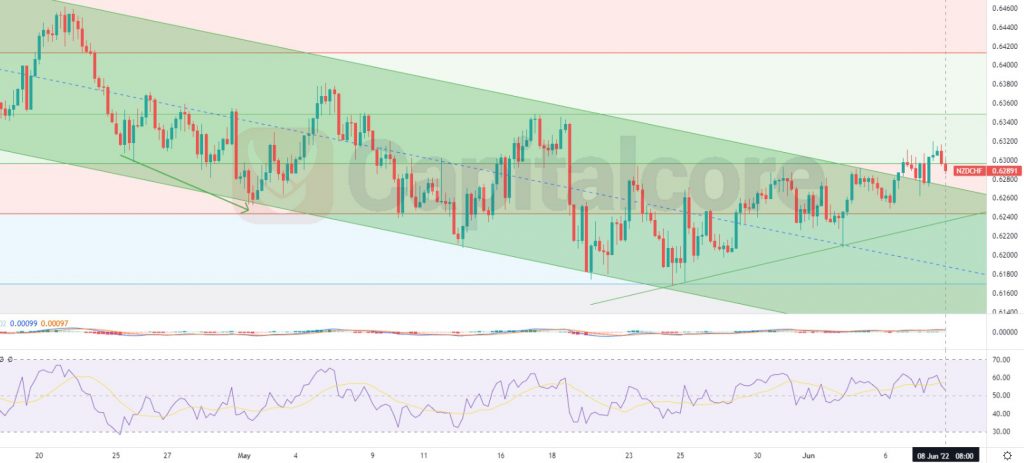
Chart Notes:
• Chart time-zone is UTC (+03:00)
• Candles’ time-frame is 4h.
The price line on NZD/CHF price chart is indicating 0.629 at the moment, which would be just above the descending channel as well as level 0.5 of the Fibonacci retracement on the previous major ascending wave. The descending channel is highlighted with green color on the chart and the line between the red and the green Fibonacci zones, indicates level 0.5. The green ascending line indicates the dynamic support which has formed the current ascending wave. Traders can be waiting for the price line to touch the ascending trend line once more and there they can enter long positions, the target for the ascending waves could be considered on 0.635 and 0.64.
Please note that, in case the price line breaks inside the channel again, the chance would again be with bears.
• DISCLAIMER: Please note that the above analysis is not an investment suggestion by “Capitalcore Ltd”. This post has been published only for educational purposes.