The price line is on a critical spot
NZD/CHF started a bullish trend on 14th of February 2022; a bullish trend line was formed during this upward trend. The price on this pair, ascended about 6.8% until 23rd of March 2022, when it reached out to level 0.618 of the Fibonacci retracement. The current zone of the price line is considered to be critical, as the price line is between level 0.618 of the Fibo0nacci retracement and the ascending trend line.
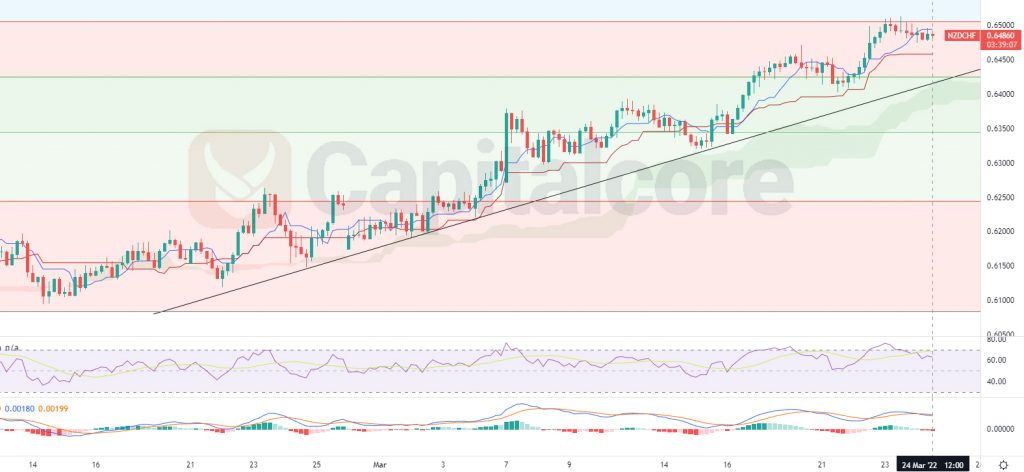
Chart Notes:
• Chart time-zone is UTC (+03:00)
• Candles’ time-frame is 4h.
On NZD/CHF price chart, the price line is on 0.6486 at the moment, which would be above the Ichimiku cloud. The black line on the chart, indicates the trend line, above which the price line formed the current ascending trend. The red area, in which the price line is ranging, is between level 0.618 and 0.5 of the Fibonacci retracement on the previous descending wave. RSI is almost on 61 and MACD is showing the commencement of a descending wave. Traders can be waiting for the price line to react to either the trend line or the Fibonacci level. In case the trend line breaks above the Fibonacci level, buyers can enter the market and target 0.662 and 0.67 as the targets for the ascending wave. On the other hand, Sellers can enter the market, if the price line breaks below the trend line, the targets for the wave could be considered on the Fibonacci different levels.
• DISCLAIMER: Please note that the above analysis is not an investment suggestion by “Capitalcore Ltd”. This post has been published only for educational purposes.