Bullish signals have been issued
NZD/CHF started an ascending wave on 3rd of February 2022; The price line ascended almost 7.2% until 23rd of March 2022. The price on this pair then entered a correction phase and at the moment, it is approaching to level 0.618 of the previous ascending wave.
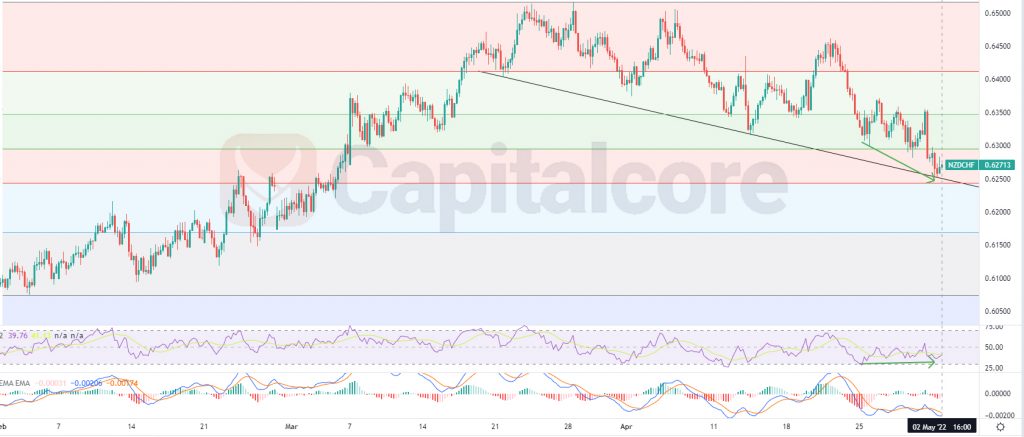
Chart Notes:
• Chart time-zone is UTC (+03:00)
• Candles’ time-frame is 4h.
NZD/CHF is trending at about 0.627, Which would be just above level 0.618 of the Fibonacci level. There is also a dynamic support at this area which has been indicated as a descending black line. The reaction of the price line to this area seems to be bullish as you see, far apart the price action on the chart, MACD is also showing a strong trend reversal. RSI is also showing positive divergence which has been shown by two green arrows. Traders can be waiting for the price line to have a retest of the previous valley, around level 0.618 of the Fibonacci retracement and then they can enter long positions. The target for the ascending wave could be considered on level 0.236 and level 0 of the Fibonacci retracement, which would be on 0.64 and 0.65.
Please consider that this theory is valid as long as the black trend line has not been broken.
• DISCLAIMER: Please note that the above analysis is not an investment suggestion by “Capitalcore Ltd”. This post has been published only for educational purposes.