The Bullish Case for NZD/CHF: Technical Indicators in Accord
The NZD/CHF currency pair, representing the exchange rate between the New Zealand Dollar and the Swiss Franc, serves as an indicator of the relative economic health between the Asia-Pacific and European regions. The following analysis examines the recent performance of NZD/CHF through the lens of Bollinger Bands and MACD indicators.
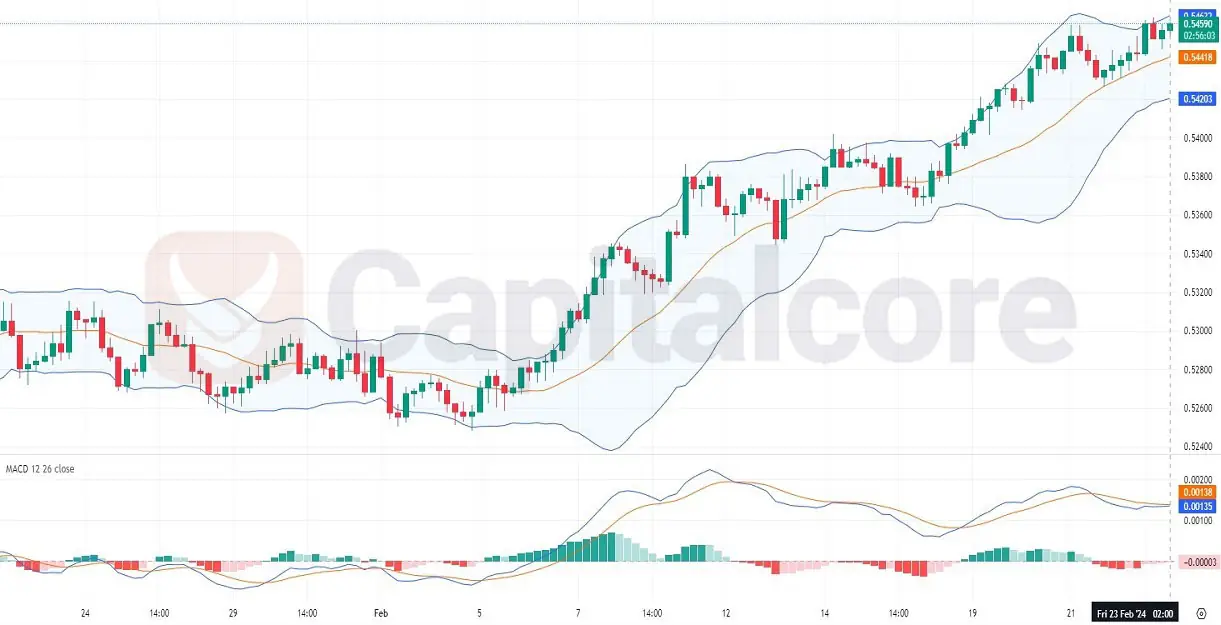
Chart Notes:
• Chart time-zone is UTC (+03:00)
• Candles’ time-frame is 4h.
The NZD/CHF pair has shown a marked uptrend on the chart, as indicated by the price consistently trading above the middle Bollinger Band, which acts as a dynamic support level. The Bollinger Bands are expanding, suggesting increased market volatility with the upper band sloping upwards, reinforcing the bullish sentiment. Meanwhile, the Moving Average Convergence Divergence (MACD) indicator presents a bullish crossover as the signal line is traversed by the MACD line from below, a sign of upward momentum. However, the histogram reflects a decrease in bullish momentum as it trends towards the zero line, hinting at a potential slowdown or consolidation in the near future. Traders should watch for the MACD line to remain above the signal line and for the price to stay within the upper half of the Bollinger Bands to maintain confidence in the current trend. A breach below the middle Bollinger Band could signify a reversal or pullback.
• DISCLAIMER: Please note that the above analysis is not an investment suggestion by “Capitalcore Ltd”. This post has been published only for educational purposes.