- January 26, 2022
- Category: Market News
The ascending trendline is broken
NZD/USD, after a sharp ascending wave, started a bearish trend on 20th of October. The price descended more than 8.1% until 24th of January and broke below the dynamic support line and is now having a retest of the broken zone. The overall look of the chart is bearish and sellers can be waiting for a trigger to open short positions.
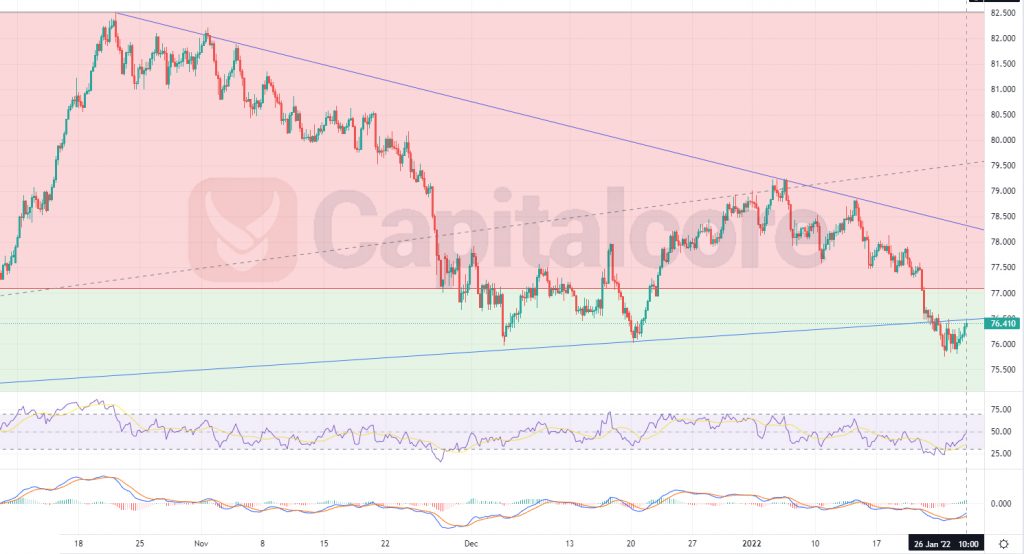
Chart Notes:
• Chart time-zone is UTC (+03:00)
• Candles’ time-frame is 4h.
The price at the moment is on 76.41 and is approaching the broken trend line to have a retest. RSI is almost on 49 and MACD is still showing ascending wave on going. There is a resistance level above the price line on 77.9 which equals to level 0.236 of the Fibonacci retracement on the previous ascending wave. 76.7 – 77.6 would be a good price for sellers to enter the market. The target for the descending wave could be considered on level 0.382 of the Fibonacci retracement which would be 73.78. The possibility for descending below this level is not much, as the price has made several reaction to this area, but still 70.2 could be considered as another target if you are willing to risk bigger for a bigger reward. This price almost equals to level 0.5 of the Fibonacci retracement, has effected the price line on previous encounters and therefore, is considered a strong support. In case the price line breaks above the blue line, the possibility of an up-coming descending wave would reduce.
• DISCLAIMER: Please note that the above analysis is not an investment suggestion by “Capitalcore Ltd”. This post has been published only for educational purposes.