The support level looks too fragile to hold the price
New Zealand has released Food Price data and the US will publish Crude Oil Inventories and there will be FOMC Members’ talks. On the chart, the price has started a bearish trend a few days ago, right now it has reached the support level at 0.66; the support level could not pump the price efficiently although bulls are trying hard to hold the price above this support zone.
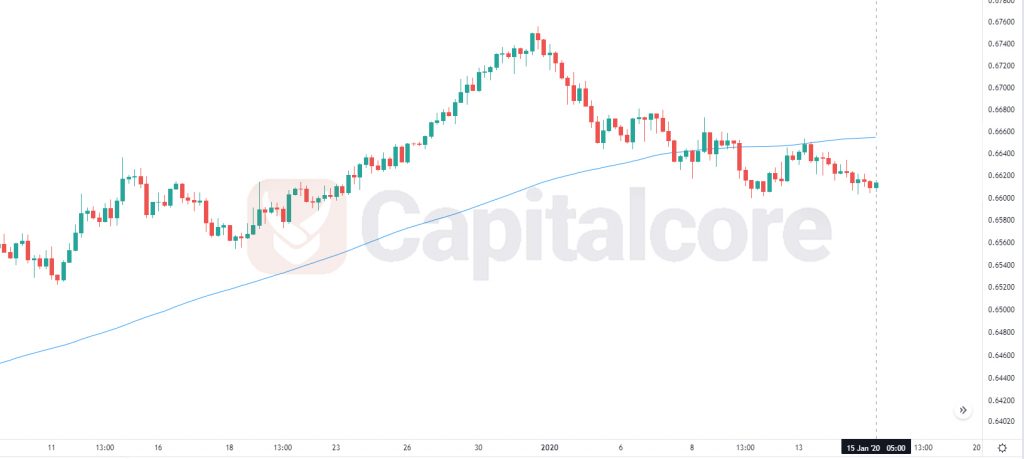
Chart Notes:
• Chart time-zone is UTC (+03:00)
• Candles’ time-frame is 4h.
The support rests at 0.65980 with resistance at 0.66280 which both lines are below the weekly pivot point at 0.66380. The EMA of 10 is moving with bearish bias in the descendant channel and it is above the EMA of 200 and below the EMA of 100. The RSI is moving below 50 level, the MACD line is below the signal line in the negative territory and the Stochastic is moving in low ranges. The ADX is not showing any clear signals. The price is below the Ichimoku Cloud and the Chinkou Span. The Tenkan-sen and the Kijun-sen are both showing a downward trend.
Short positions are recommended towards 0.65800.
• DISCLAIMER: Please note that the above analysis is not an investment suggestion by “Capitalcore Ltd”. This post has been published only for educational purposes.