The support level looks too fragile to hold the price
Official Cash Rate and RBNZ Rate Statement were released in New Zealand and the US will publish Crude Oil Inventories. A big change is expected to appear in price chart by the next few days; and since the price is at a very strong resistance, it is more likely to see a huge dump than a pump.
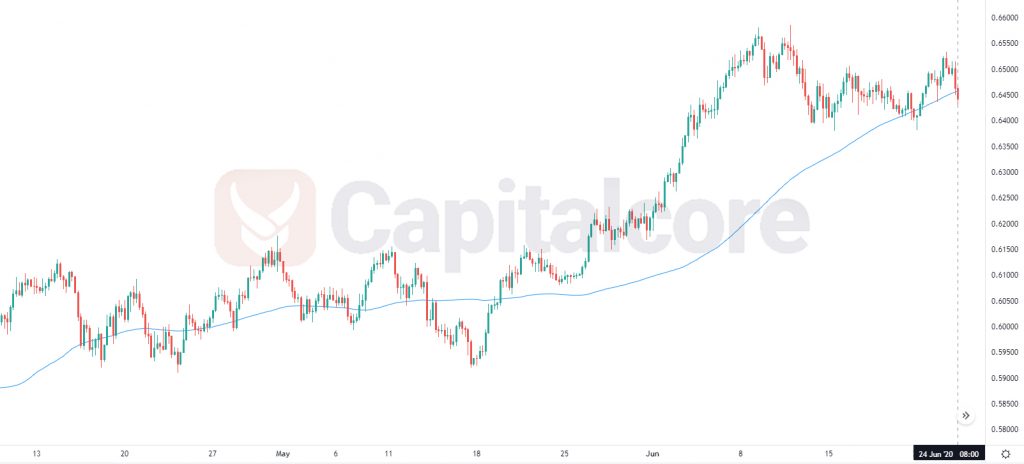
Chart Notes:
• Chart time-zone is UTC (+03:00)
• Candles’ time-frame is 4h.
The support rests at 0.63730 with resistance at 0.65650 which the weekly pivot point at 0.64320 is located in between the lines. The EMA of 10 is moving horizontally in the horizontal channel and it is located above the EMA of 200 and the EMA of 100. The RSI is moving on level 50, the MACD line is above the signal line in the positive territory and the Stochastic is showing downward momentum. The ADX is not showing any clear signals. The price is in the Ichimoku Cloud and below the Chinkou Span. The Tenkan-sen and the Kijun-sen are both showing a horizontal trend.
Short positions are recommended towards 0.63500.
• DISCLAIMER: Please note that the above analysis is not an investment suggestion by “Capitalcore Ltd”. This post has been published only for educational purposes.