The strong resistance finally gave up
ANZ Business Confidence has been released in New Zealand and the US will publish Unemployment Claims, Continuing Claims and Crude Oil Inventories. On the price chart, the strong resistance at 0.6075 got broken by the price line finally and a bullish channel is being formed.
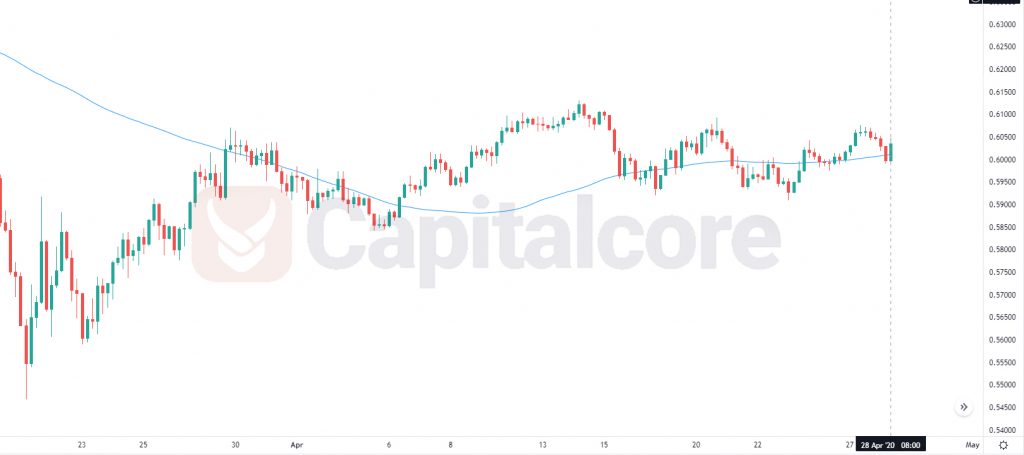
Chart Notes:
• Chart time-zone is UTC (+03:00)
• Candles’ time-frame is 4h.
The support rests at 0.61520 with resistance at 0.62150 which both lines are above the weekly pivot point at 0.60590. The EMA of 10 is moving with bullish bias in the ascendant channel and it is above the EMA of 200 and the EMA of 100. The RSI is moving in overbought area, the MACD line is below the signal line in the negative territory and the Stochastic is showing upward momentum. The ADX is showing buy signal. The price is above the Ichimoku Cloud and the Chinkou Span. The Tenkan-sen and the Kijun-sen are both showing a horizontal trend.
Long positions are recommended towards 0.62450.
• DISCLAIMER: Please note that the above analysis is not an investment suggestion by “Capitalcore Ltd”. This post has been published only for educational purposes.