The price is between a strong resistance and a strong support
Business NZ Manufacturing Index and Food Price data have been released in New Zealand and the US will publish Import price index and Michigan Consumer Sentiment Index. The price is at the bottom of a descending channel and has the flat of Ichimuko cloud above its self.
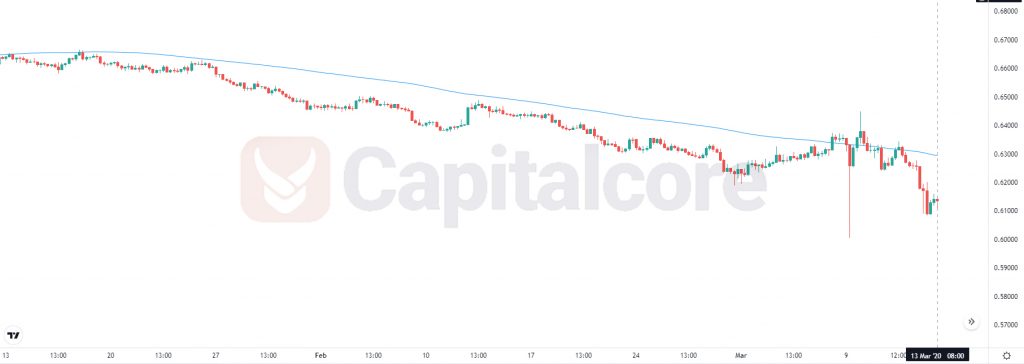
Chart Notes:
• Chart time-zone is UTC (+03:00)
• Candles’ time-frame is 4h.
The support rests at 0.60680 with resistance at 0.62000 which both lines are below the weekly pivot point at 0.63090. The EMA of 10 is moving with bearish bias in the descendant channel and it is below the EMA of 200 and the EMA of 100. The RSI is moving below 50 level, the MACD line is below the signal line in the negative territory and the Stochastic is showing upward momentum. The ADX is showing sell signal. The price is below the Ichimoku Cloud and above the Chinkou Span. The Tenkan-sen and the Kijun-sen are both showing a horizontal trend.
NZDUSD will be fluctuating within the support and resistance lines.
• DISCLAIMER: Please note that the above analysis is not an investment suggestion by “Capitalcore Ltd”. This post has been published only for educational purposes.