A trend reversal looks potential
As a result of a significant descending wave, which started forming on 12th of Aug, 2022, the price line on NZD/USD price chart, went through a 7.2% loss. The price line then reacted to a support zone at almost 0.6 and is now potential of starting a bullish phase.
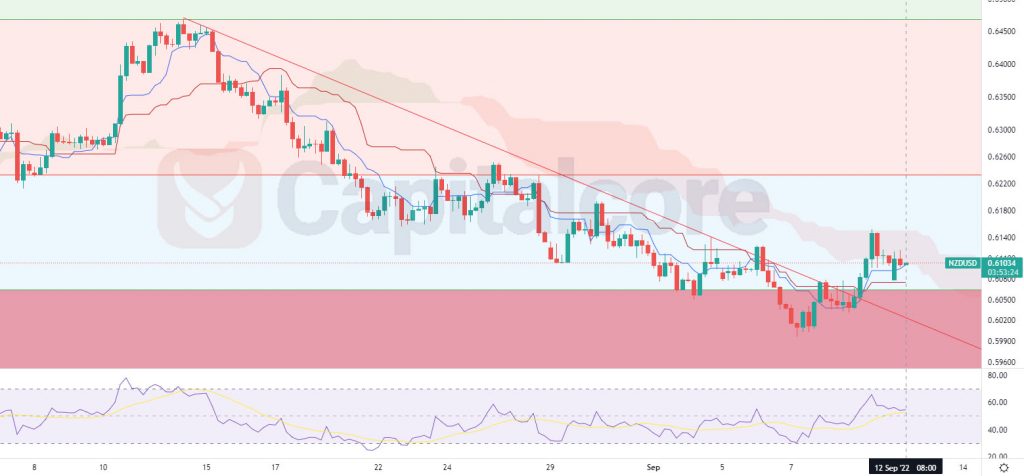
Chart Notes:
• Chart time-zone is UTC (+03:00)
• Candles’ time-frame is 4h.
The dark red zone below the price line is indicating the support level, which is expected to stop or at least weaken the bearish trend. The descending re line indicates the trend line which had formed the bearish wave; this trend is considered finished as the trend line has been penetrated. RSI indicator is also issuing a positive divergence, comparing the latest three valleys on the price chart and the RSI. The Ichimoku Cloud has turned green and the price line is struggling to break above this area. Traders can be waiting for the price line to have a retest of the broken trend line; there they can enter long positions heading to 0.6234 and 0.63588. Also consider that in case the price line breaks below 0.59872, the chance would be more with sellers than the buyers.
• DISCLAIMER: Please note that the above analysis is not an investment suggestion by “Capitalcore Ltd”. This post has been published only for educational purposes.