Descending wave coud not break through the Ichimoku cloud
There are no major economic reports in the US but Westpac Consumer Confidence will be released in New Zealand. The trend is still bullish in NZD/USD price chart. The previous descending line could not break the support at 0.7 and Ichimoku pumped the price up.
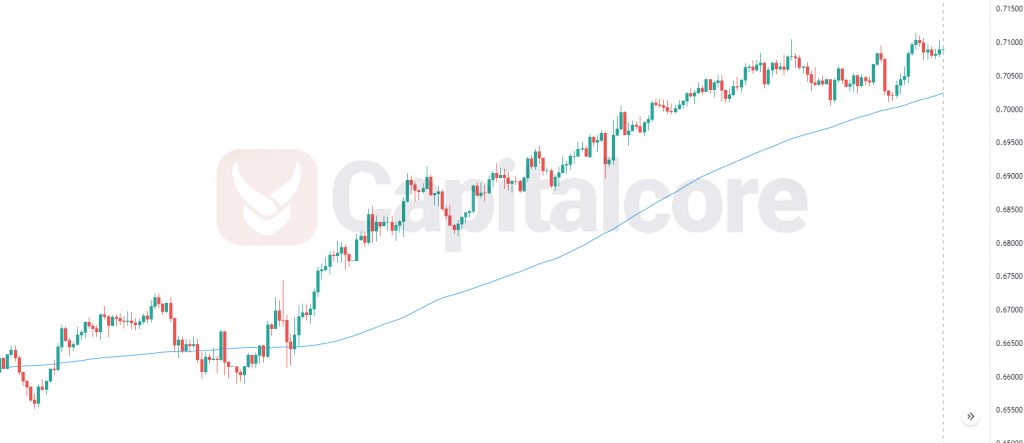
Chart Notes:
• Chart time-zone is UTC (+03:00)
• Candles’ time-frame is 4h.
The support rests at 0.70820 with resistance at 0.71320 which both lines are above the weekly pivot point at 0.70700. The EMA of 10 is moving with bullish bias in the ascendant channel and it is above the EMA of 200 and the EMA of 100. The RSI is moving is overbought area, the MACD line is above the signal line in the positive territory and the Stochastic is showing upward momentum. The ADX is showing buy signal. The price is above the Ichimoku Cloud and the Chinkou Span. The Tenkan-sen and the Kijun-sen are both showing a horizontal trend.
NZDUSD is growing within the ascendant channel targeting 0.71500.
• DISCLAIMER: Please note that the above analysis is not an investment suggestion by “Capitalcore Ltd”. This post has been published only for educational purposes.