Correction phase seems to be over
ANZ Commodity Prices data has been released in New Zealand. NZD is trying to recover from the huge dump that happened on 9th till 19th of March. The price line is now touching MA100 and in case this area is broken, another bullish trend is expected.
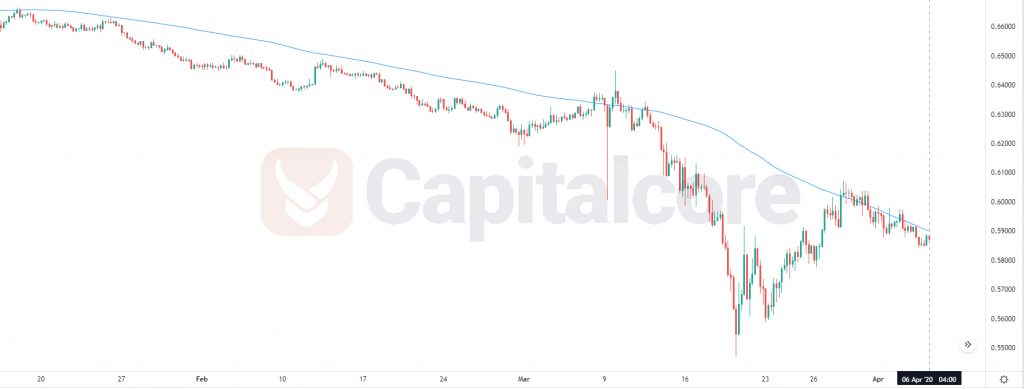
Chart Notes:
• Chart time-zone is UTC (+03:00)
• Candles’ time-frame is 4h.
The support rests at 0.58430 with resistance at 0.59540 which both lines are below the weekly pivot point at 0.60220. The EMA of 10 is moving with bearish bias in the descendant channel and it is below the EMA of 200 and the EMA of 100. The RSI is rising towards 50 level, the MACD line is on the signal line in the neutral territory and the Stochastic is showing upward momentum. The ADX is not showing any clear signals. The price is in the Ichimoku Cloud and above the Chinkou Span. The Tenkan-sen and the Kijun-sen are both showing a horizontal trend.
Long positions are recommended towards 0.60000.
• DISCLAIMER: Please note that the above analysis is not an investment suggestion by “Capitalcore Ltd”. This post has been published only for educational purposes.