The next move is going to be big
Balance of Trade, Imports and Exports data will be released in New Zealand and the US will publish Building Permits and Housing Starts data. On the chart the price is reacting to a strong resistance, the support stays long away from the price and the next move will be critical.
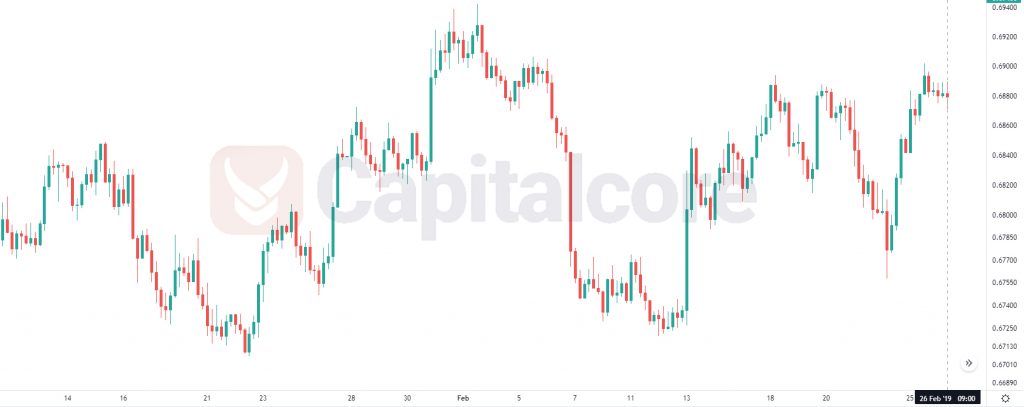
Chart Notes:
• Chart time-zone is UTC (+03:00)
• Candles’ time-frame is 4h.
The support rests at 0.68650 with resistance at 0.68890 which both lines are above the weekly pivot point at 0.68340. The EMA of 10 is moving with bullish bias in the ascendant channel and it is above the EMA of 200 and the EMA of 100. The RSI is falling towards 50 level, the MACD line is above the signal line in the positive territory and the Stochastic is showing downward momentum. The ADX is not showing any clear signals. The price is above the Ichimoku Cloud and the Chinkou Span. The Tenkan-sen is showing an upward trend while the Kijun-sen is showing a horizontal trend.
The indicators are showing mixed signals therefore the support level breakdown may push the price lower towards 0.6850, otherwise, NZDUSD may grow towards 0.69.
• DISCLAIMER: Please note that the above analysis is not an investment suggestion by “Capitalcore Ltd”. This post has been published only for educational purposes.