The previous resistance was broken
There are no major economic reports due to holidays. Unemployment Claims and Continuing Claims will be published in the US. NZD/USD price is improving significantly and there is no sign of a trend reversal. 0.725 which acted as resistance level in the previous ascend, was broken by the price line and right now the price is above that area.
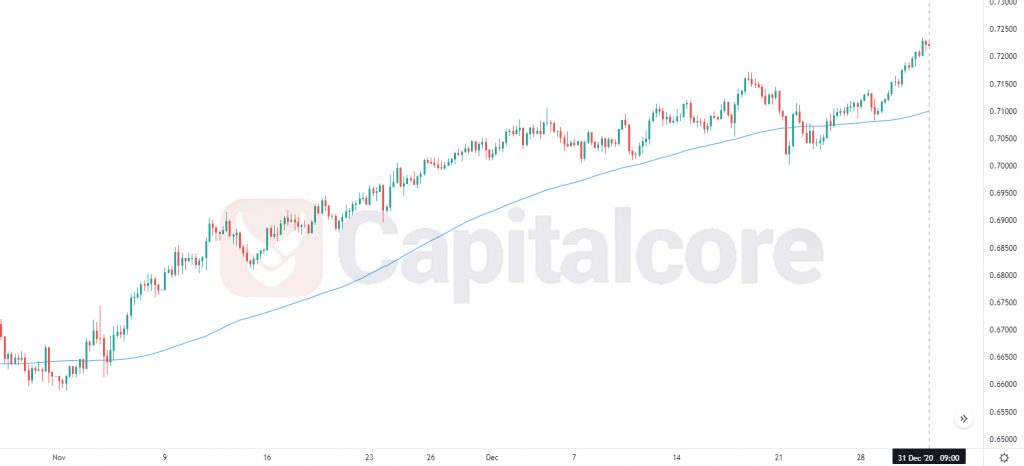
Chart Notes:
• Chart time-zone is UTC (+03:00)
• Candles’ time-frame is 4h.
NZDUSD is finding support at 0.71750 with resistance at 0.72740 which both lines are above the weekly pivot point at 0.70840. The EMA of 10 is moving with bullish bias in the ascendant channel and it is above the EMA of 200 and the EMA of 100. The RSI is moving is overbought area, the MACD line is above the signal line in the positive territory and the Stochastic is showing upward momentum. The ADX is showing buy signal. The price is above the Ichimoku Cloud below and the Chinkou Span. The Tenkan-sen and the Kijun-sen are both showing a horizontal trend.
Long positions are recommended towards 0.73000.
• DISCLAIMER: Please note that the above analysis is not an investment suggestion by “Capitalcore Ltd”. This post has been published only for educational purposes.