Descending triangle is formed on the chart
NZD/USD price, started a sharp bearish step on 5th of April 2022, which led the price line to descend about 11.5% until 12th of May 2022, when the price line reached to a static resistance level; after going through some correction phases, the price line formed a descending triangle on the chart and is now issuing some bullish signals.
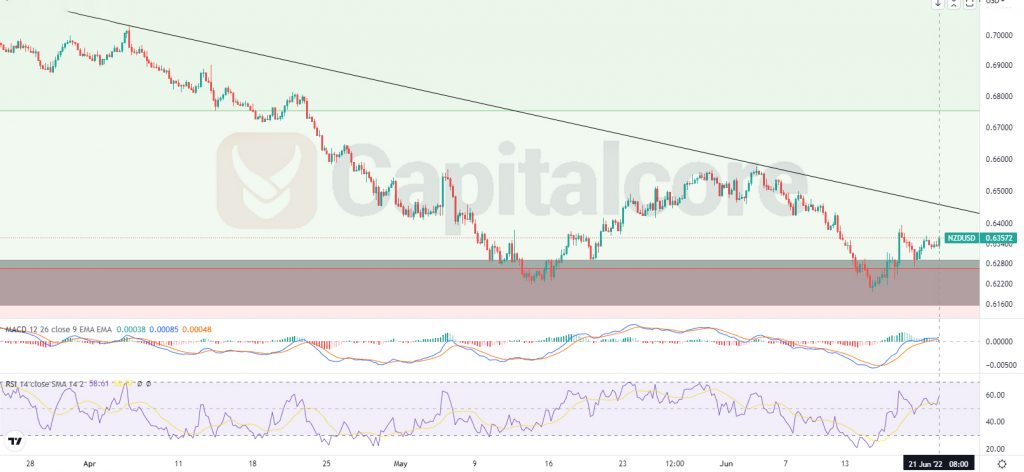
Chart Notes:
• Chart time-zone is UTC (+03:00)
• Candles’ time-frame is 4h.
The price line on NZD/USD price chart is currently indicating 0.63572, which would be just above a static resistance level, which lays at 0.61566 – 0.6278. This resistance level is shown as a dark zone below the price line. The black descending line on the chart, represents the bearish trend line which has formed the current descending wave. As you can see on the chart, the descending slope of the price line on this pair has currently decreased and the bullish power seems to be enhancing. RSI has issued positive divergence both on daily and weekly time frame. MACD is also issuing bullish signals at different time frames. Traders can be waiting for the price line to break above the black trend line and then they can enter long positions on the retest of this trend line. The targets for the bullish wave could be considered on 0.675 and 0.7.
Please consider that this analysis would lose value if the price line breaks below the static support zone.
• DISCLAIMER: Please note that the above analysis is not an investment suggestion by “Capitalcore Ltd”. This post has been published only for educational purposes.