- October 13, 2020
- Category: Market News
The support level looks too fragile to hold the price
Food Price data was released in New Zealand. Consumer Price Index and Federal Budget Balance data will be reported in the US. Everything is ready for a strong bullish trend. On the other hand a flag pattern is formed at the top of a bullish trend, different indicators are issuing buy signal.
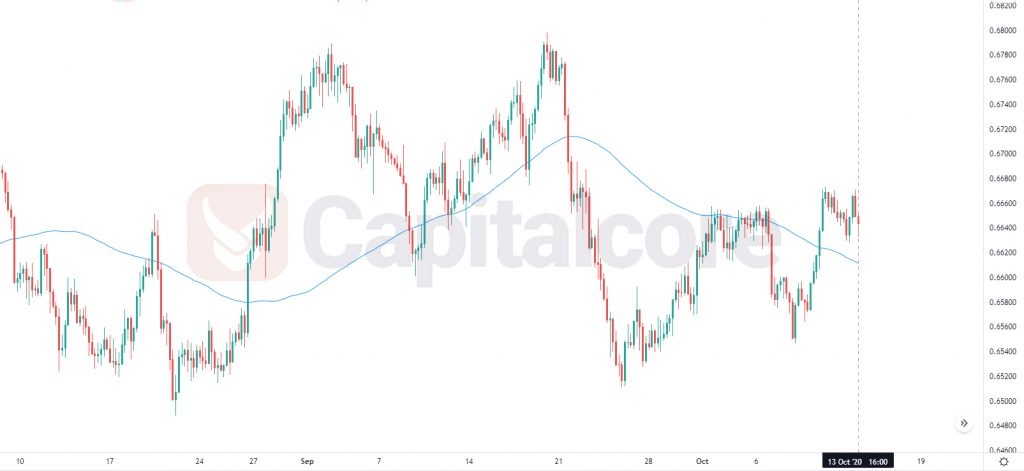
Chart Notes:
• Chart time-zone is UTC (+03:00)
• Candles’ time-frame is 4h.
The support rests at 0.66140 with resistance at 0.66770 which the weekly pivot point at 0.66310 is located in between the lines. The EMA of 10 is moving with bullish bias in the ascendant channel and it is located above the EMA of 200 and the EMA of 100. The RSI is falling towards level 50, the MACD line is above the signal line in the positive territory and the Stochastic is showing upward momentum. The ADX is showing buy signal. The price is above the Ichimoku Cloud and below the Chinkou Span. The Tenkan-sen and the Kijun-sen are both showing a horizontal trend.
Long positions are recommended towards 0.66800.
• DISCLAIMER: Please note that the above analysis is not an investment suggestion by “Capitalcore Ltd”. This post has been published only for educational purposes.