Breaking bullish trendline failed
NZD/USD started a bullish move since 13th of April; this trend formed a bullish channel in the price chart. On 30th of April the bullish trendline was broken and after a few days, the price fall to 0.711. The bulls then could pump the price up again and right now it is back on the broken ascending trendline. In case the trendline can hold the price again, a strong bullish step is expected.
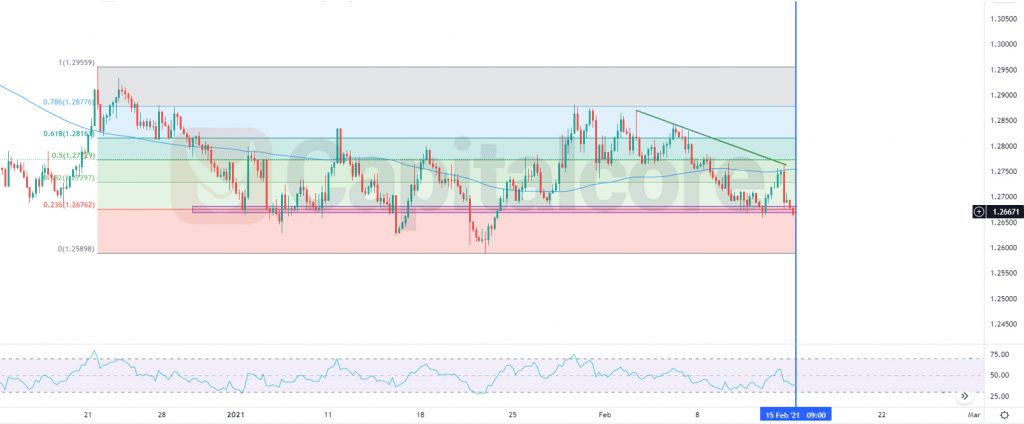
Chart Notes:
• Chart time-zone is UTC (+03:00)
• Candles’ time-frame is 4h.
NZDUSD trading in uptrend line and It is expected a bullish movement to resistance level around 0.72620. The support rests at 0.72620 with resistance at 0.72900 which the price is above the Pivot Point at 0.72720 located between the lines. The EMA of 10 is moving in bullish bias in the ascendant channel and it is above EMA of 100 and the EMA of 200. The RSI is moving in overbought area, the MACD histogram is in negative territory and the Stochastic is moving in low ranges. The ADX is moving horizontally.
The price is above the Ichimoku Cloud and the Chinkou Span is far away from the market price which shows a strong trend. The Tenkan-sen and the Kijun-sen are both showing an upward momentum.
• There is resistance at 0.72900, followed by resistance at 0.73000 and 0.73180.
• There is support at 0.72620 Below, there is 0.72440 and 0.72340.
• DISCLAIMER: Please note that the above analysis is not an investment suggestion by “Capitalcore Ltd”. This post has been published only for educational purposes.