Ichimuko cloud resistance was broken
Producer Price Index was released in New Zealand and the US will publish FOMC Meeting Minutes and Crude Oil Inventories. On the chart, the price line was able to break through the Ichimuko cloud and is looking bullish. Ichimuko cloud is now supporting the price and it is not expected to see a powerful bearish trend in the next few days.
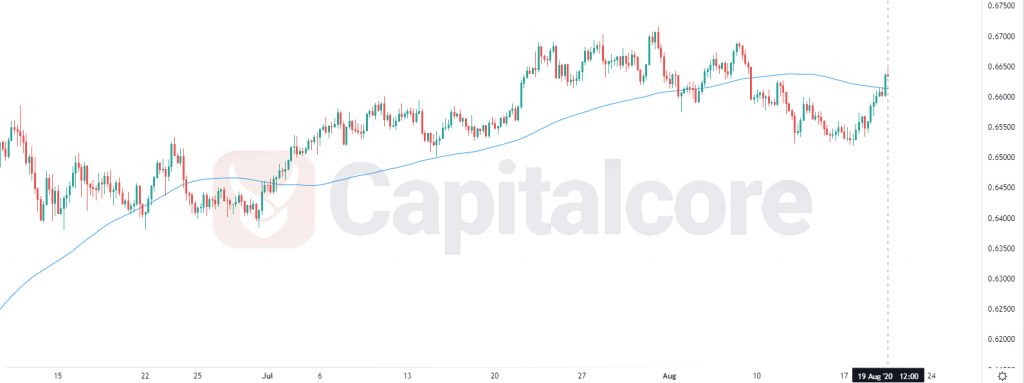
Chart Notes:
• Chart time-zone is UTC (+03:00)
• Candles’ time-frame is 4h.
The support rests at 0.65950 with resistance at 0.66550 which both lines are above the weekly pivot point at 0.65650. The EMA of 10 is moving with bullish bias in the ascendant channel and it is located above the EMA of 200 and below the EMA of 100. The RSI is moving in overbought area, the MACD line is above the signal line in the positive territory and the Stochastic is moving in high ranges. The ADX is showing buy signal. The price is above the Ichimoku Cloud and above the Chinkou Span. The Tenkan-sen and the Kijun-sen are both showing an upward trend.
Long positions are recommended towards 0.67500.
• DISCLAIMER: Please note that the above analysis is not an investment suggestion by “Capitalcore Ltd”. This post has been published only for educational purposes.