A descending wave is close
Business NZ PMI has been released in New Zealand and the US will publish Michigan Consumer Sentiment Prel. On the chart, The price line after forming a double top, had a small correction phase and now is touching the resistance level again.
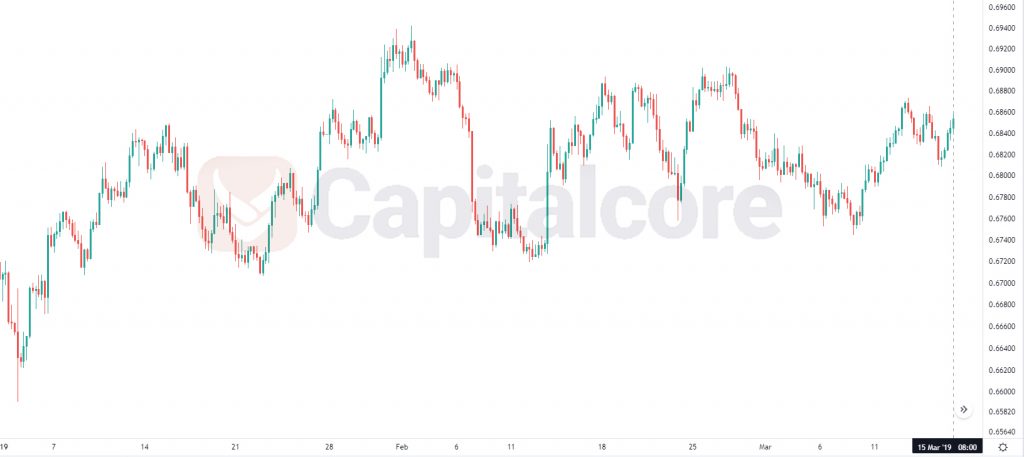
Chart Notes:
• Chart time-zone is UTC (+03:00)
• Candles’ time-frame is 4h.
The support rests at 0.68330 with resistance at 0.68710 which both lines are above the weekly pivot point at 0.67920. The EMA of 10 is moving horizontally in the ascendant channel and it is above the EMA of 200 and the EMA of 100. The RSI is moving above the 50 level, the MACD line is below the signal line in the negative territory and the Stochastic is showing upward momentum. The ADX is not showing any clear signals. The price is above the Ichimoku Cloud and below the Chinkou Span. The Tenkan-sen is showing a downward trend while the Kijun-sen is showing an upward trend.
The indicators are showing mixed signals. Bears can target 0.68.
• DISCLAIMER: Please note that the above analysis is not an investment suggestion by “Capitalcore Ltd”. This post has been published only for educational purposes.