The price is on the mid lane of ascending channel
Consumer Price Index was released in New Zealand and the US will publish Crude Oil Inventories. USDX’s decline is weighing on USD. Meanwhile on the chart, the price is forming an ascending channel. A couple of days ago, the price touched the top of the channel and had a freefall to the mid lane of the channel. If the mid lane can play the role of a dynamic support, the next move is expected to be a big growth.
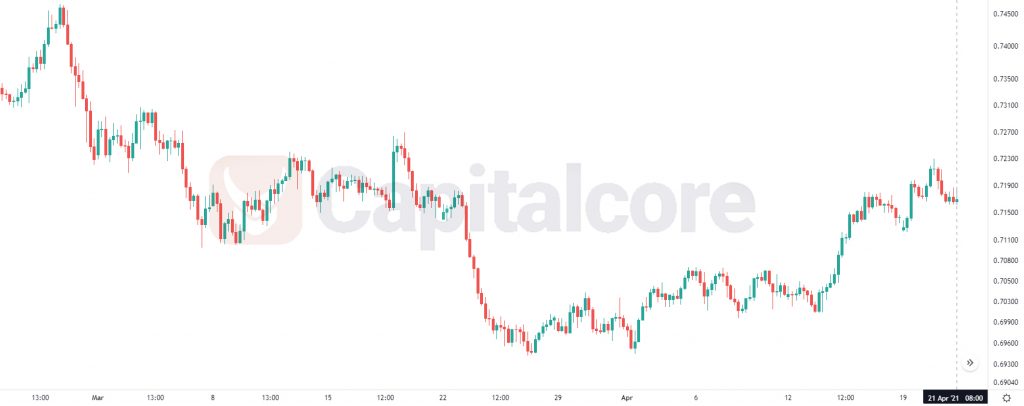
Chart Notes:
• Chart time-zone is UTC (+03:00)
• Candles’ time-frame is 4h.
The support rests at 0.71330 with resistance at 0.72050 which the weekly pivot point at 0.71100 is located below the lines. The EMA of 10 is moving horizontally in the ascendant channel and it is above the EMA of 200 and the EMA of 100. The RSI is growing above level 50, the MACD line is below the signal line in the negative territory and the Stochastic is moving in low ranges. The ADX is not showing any clear signals. The price is in the Ichimoku Cloud and above the Chinkou Span. The Tenkan-sen is showing a horizontal trend and the Kijun-sen is showing an upwards trend.
Long positions are recommended towards 0.72600.
• DISCLAIMER: Please note that the above analysis is not an investment suggestion by “Capitalcore Ltd”. This post has been published only for educational purposes.